Easy ElasticSearch K8s Monitoring
Application monitoring is vital to make DevOps effective. With Prometheus and Grafana, it has become relatively straightforward to set up the monitoring framework but maintaining the storage framework and associated operational overhead is difficult and time consuming. MayaData Director is a solution. Director is free for basic usage and available both as a SaaS service and OnPrem (as a Kubernetes-native application).

ElasticSearch monitoring with OpenEBS Director
While Director began its life as a cross-cloud visibility and control plane for OpenEBS itself, the MayaData team extended its capabilities to encompass any K8s application. In its latest release, Director adds Grafana-based monitoring dashboards for five stateful applications most commonly used in the OpenEBS community: ElasticSearch, MySQL, MinIO, PostgreSQL, Redis, and CockroachDB.
We have provided details about ElasticSearch (ECK) on OpenEBS in prior blogs describing the need for a dynamic LocalPV as well how to use dynamic LocalPV for scaling up. In this blog, we will show how to monitor ElasticSearch for free in just a few clicks.
Quick Start for ElasticSearch monitoring on OpenEBS Director
- Start ElasticSearch with OpenEBS LocalPV (Optional): If you are starting with ElasticSearch, use OpenEBS LocalPV for simplicity in setup, high performance, and easy scalability. See the blog for more details.
- Connect your K8s to OpenEBS Director: If you are already running ElasticSearch, connect your Kubernetes cluster to Director Online or Director OnPrem.
- In your Director console, Go to - your cluster> Applications > ElasticSearch
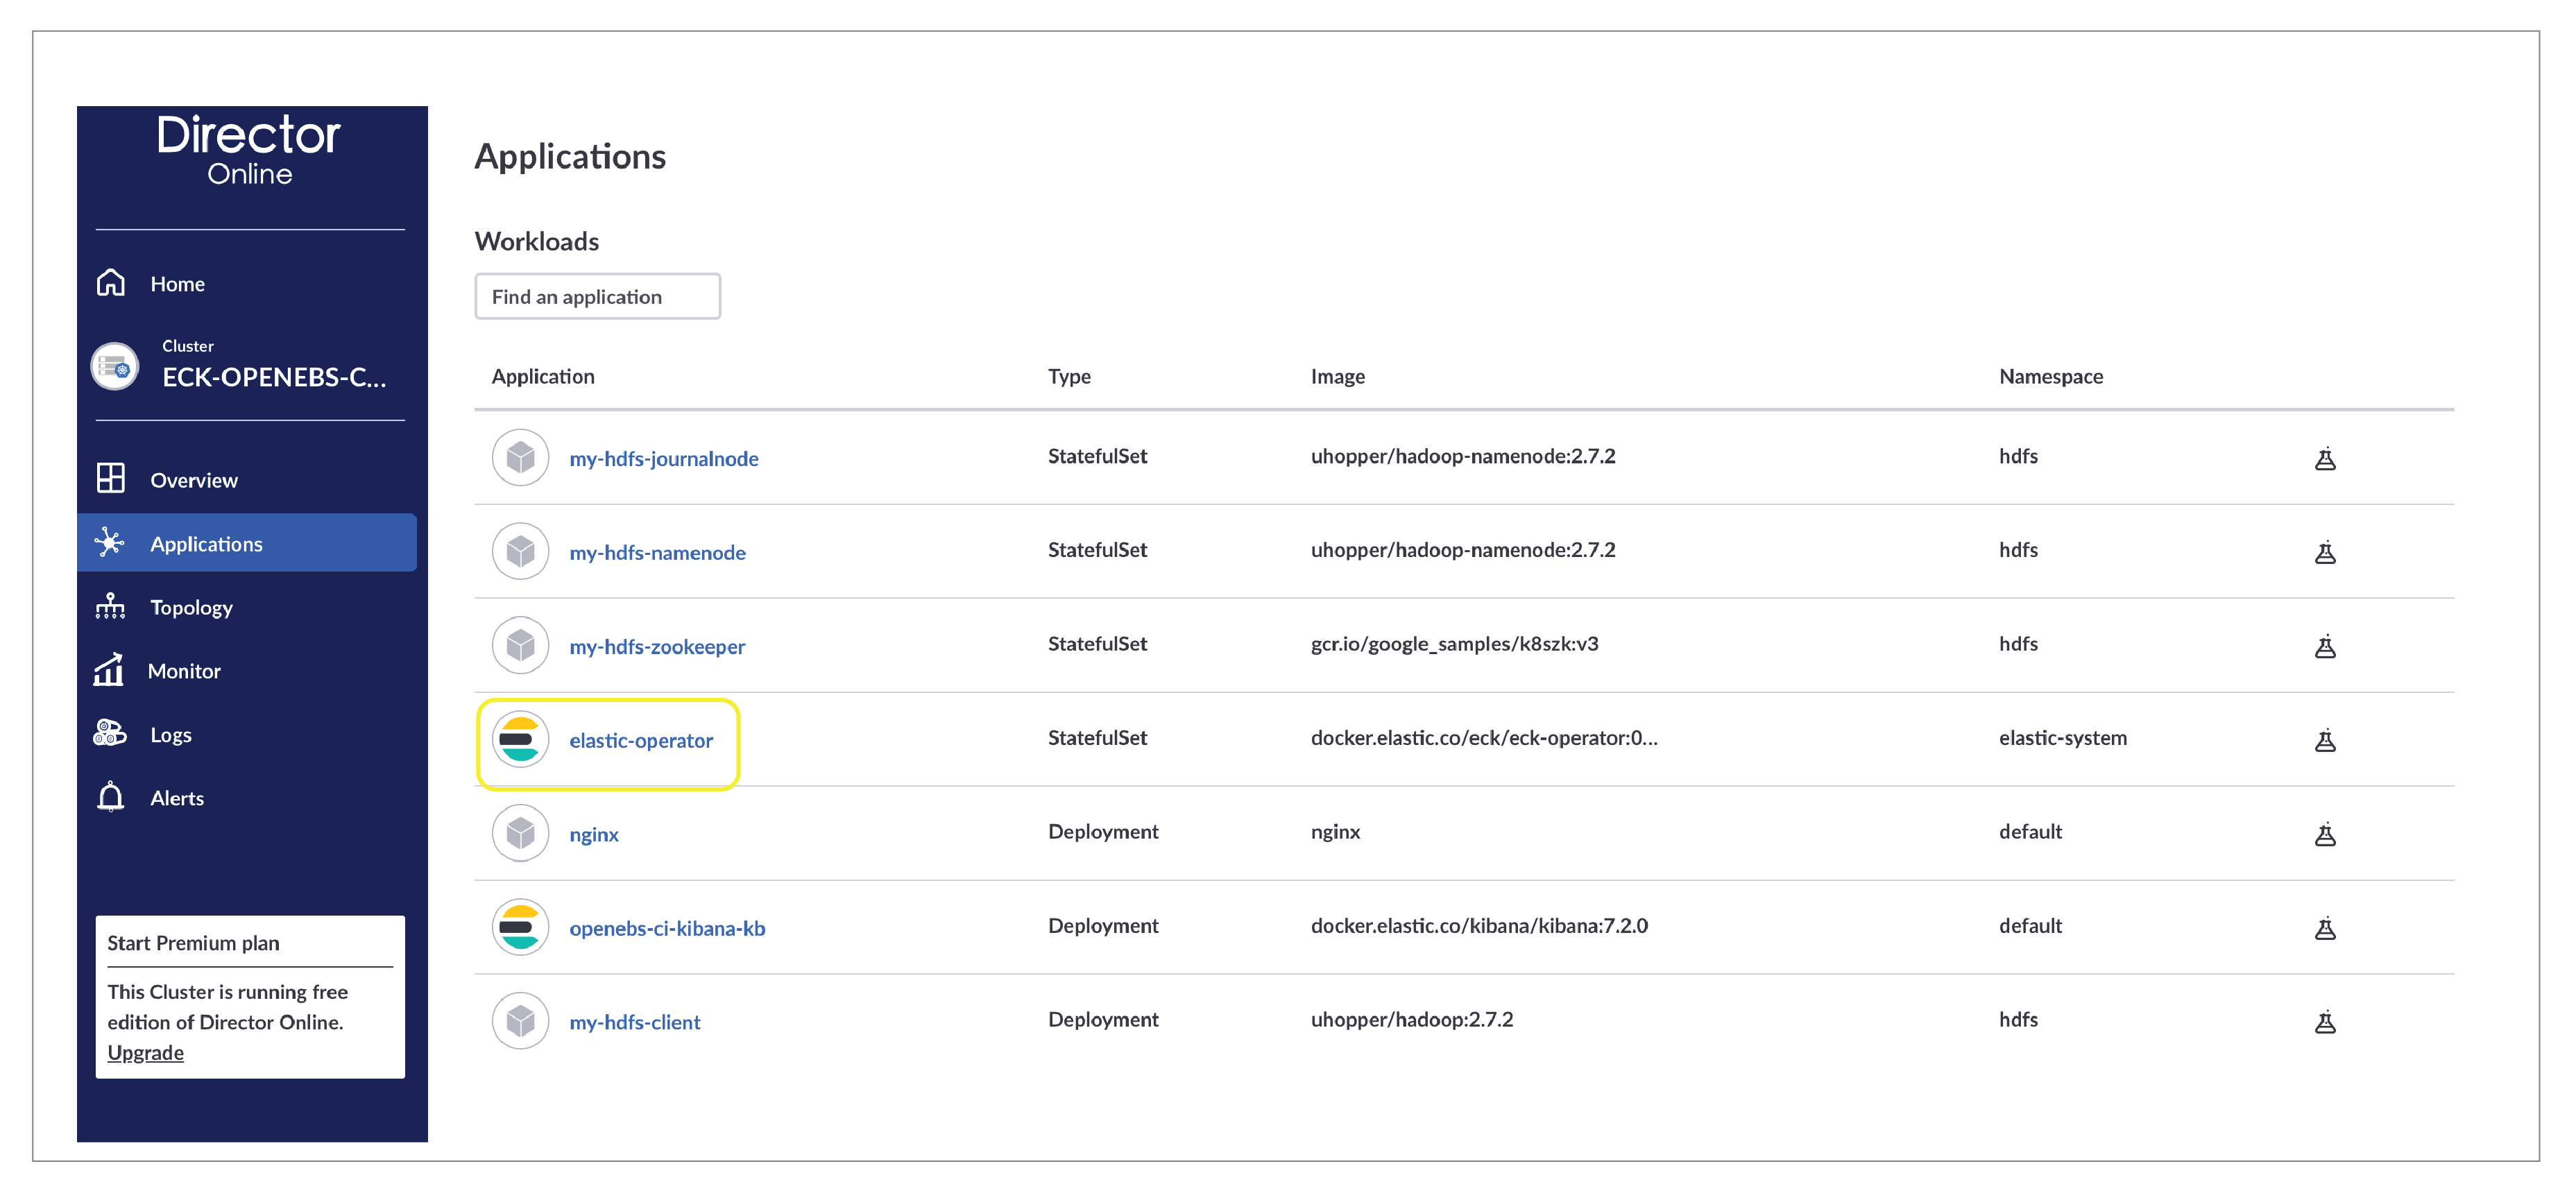
- Click Analytics: Analytics is provided at various levels. We are not referring to application analytics. Click on “Analytics” in the application screen of your ElasticSearch cluster.

- Fill in ElasticSearch username, password, service name, and port
i. Username is by default - “elastic”
ii. For service port and servicename - use the following command
root@openebs-ci-master:~# kubectl get svc
NAME TYPE CLUSTER-IP EXTERNAL-IP PORT(S) AGE
kubernetes ClusterIP 10.96.0.1 <none> 443/TCP 15d
nginx NodePort 10.111.33.124 <none> 80:32557/TCP 11d
openebs-ci-elastic-es-http NodePort 10.103.37.94 <none> 9200:32465/TCP 12d
openebs-ci-kibana-kb-http NodePort 10.106.239.219 <none> 5601:31829/TCP 12d
In the above example, the service name is openebs-ci-elastic-es-http and the service port is 9200
iii. For password, use the following commandkubectl get secret <your-elastic>-es-elastic-user -o=jsonpath='{.data.elastic}' | base64 --decode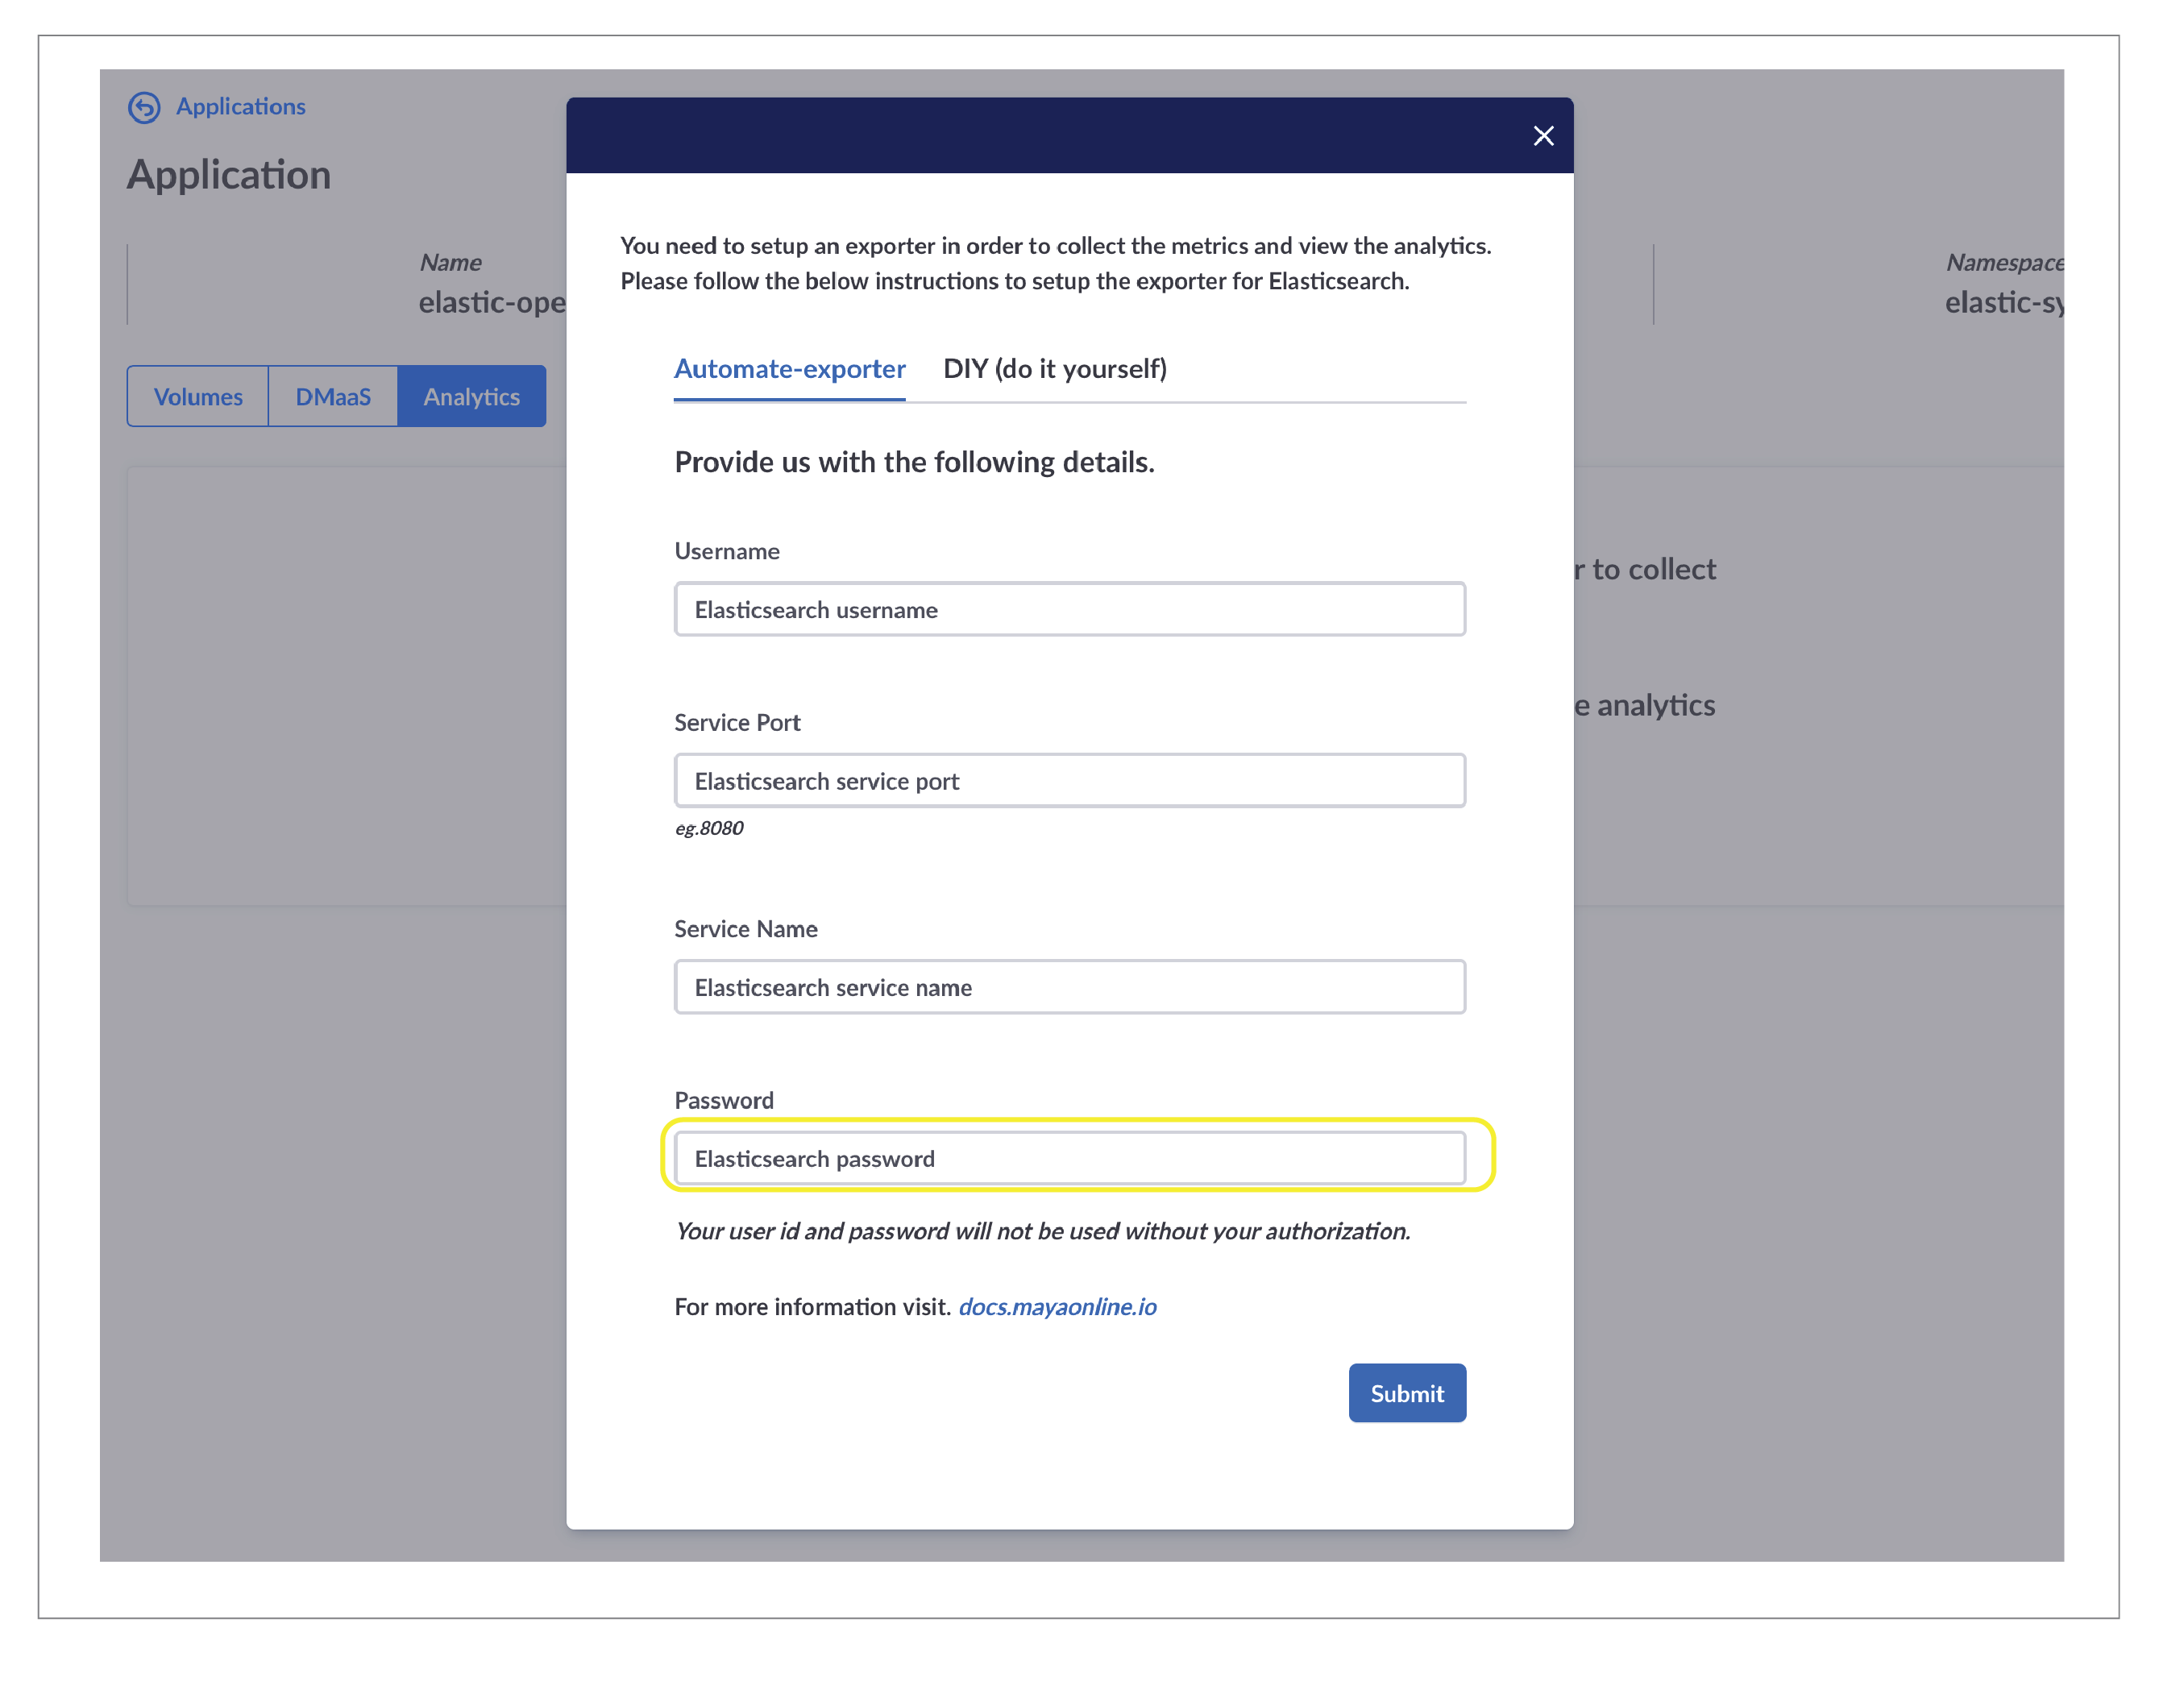
- Once the above configuration is applied, a metrics exporter will be created for your ElasticSearch, and the metrics are exported to DirectorOnline.
i. Note: This procedure can take a few minutes as it launches new containers and configures them.
ii. The ElasticSearch DashBoard on DirectorOnline looks like below.
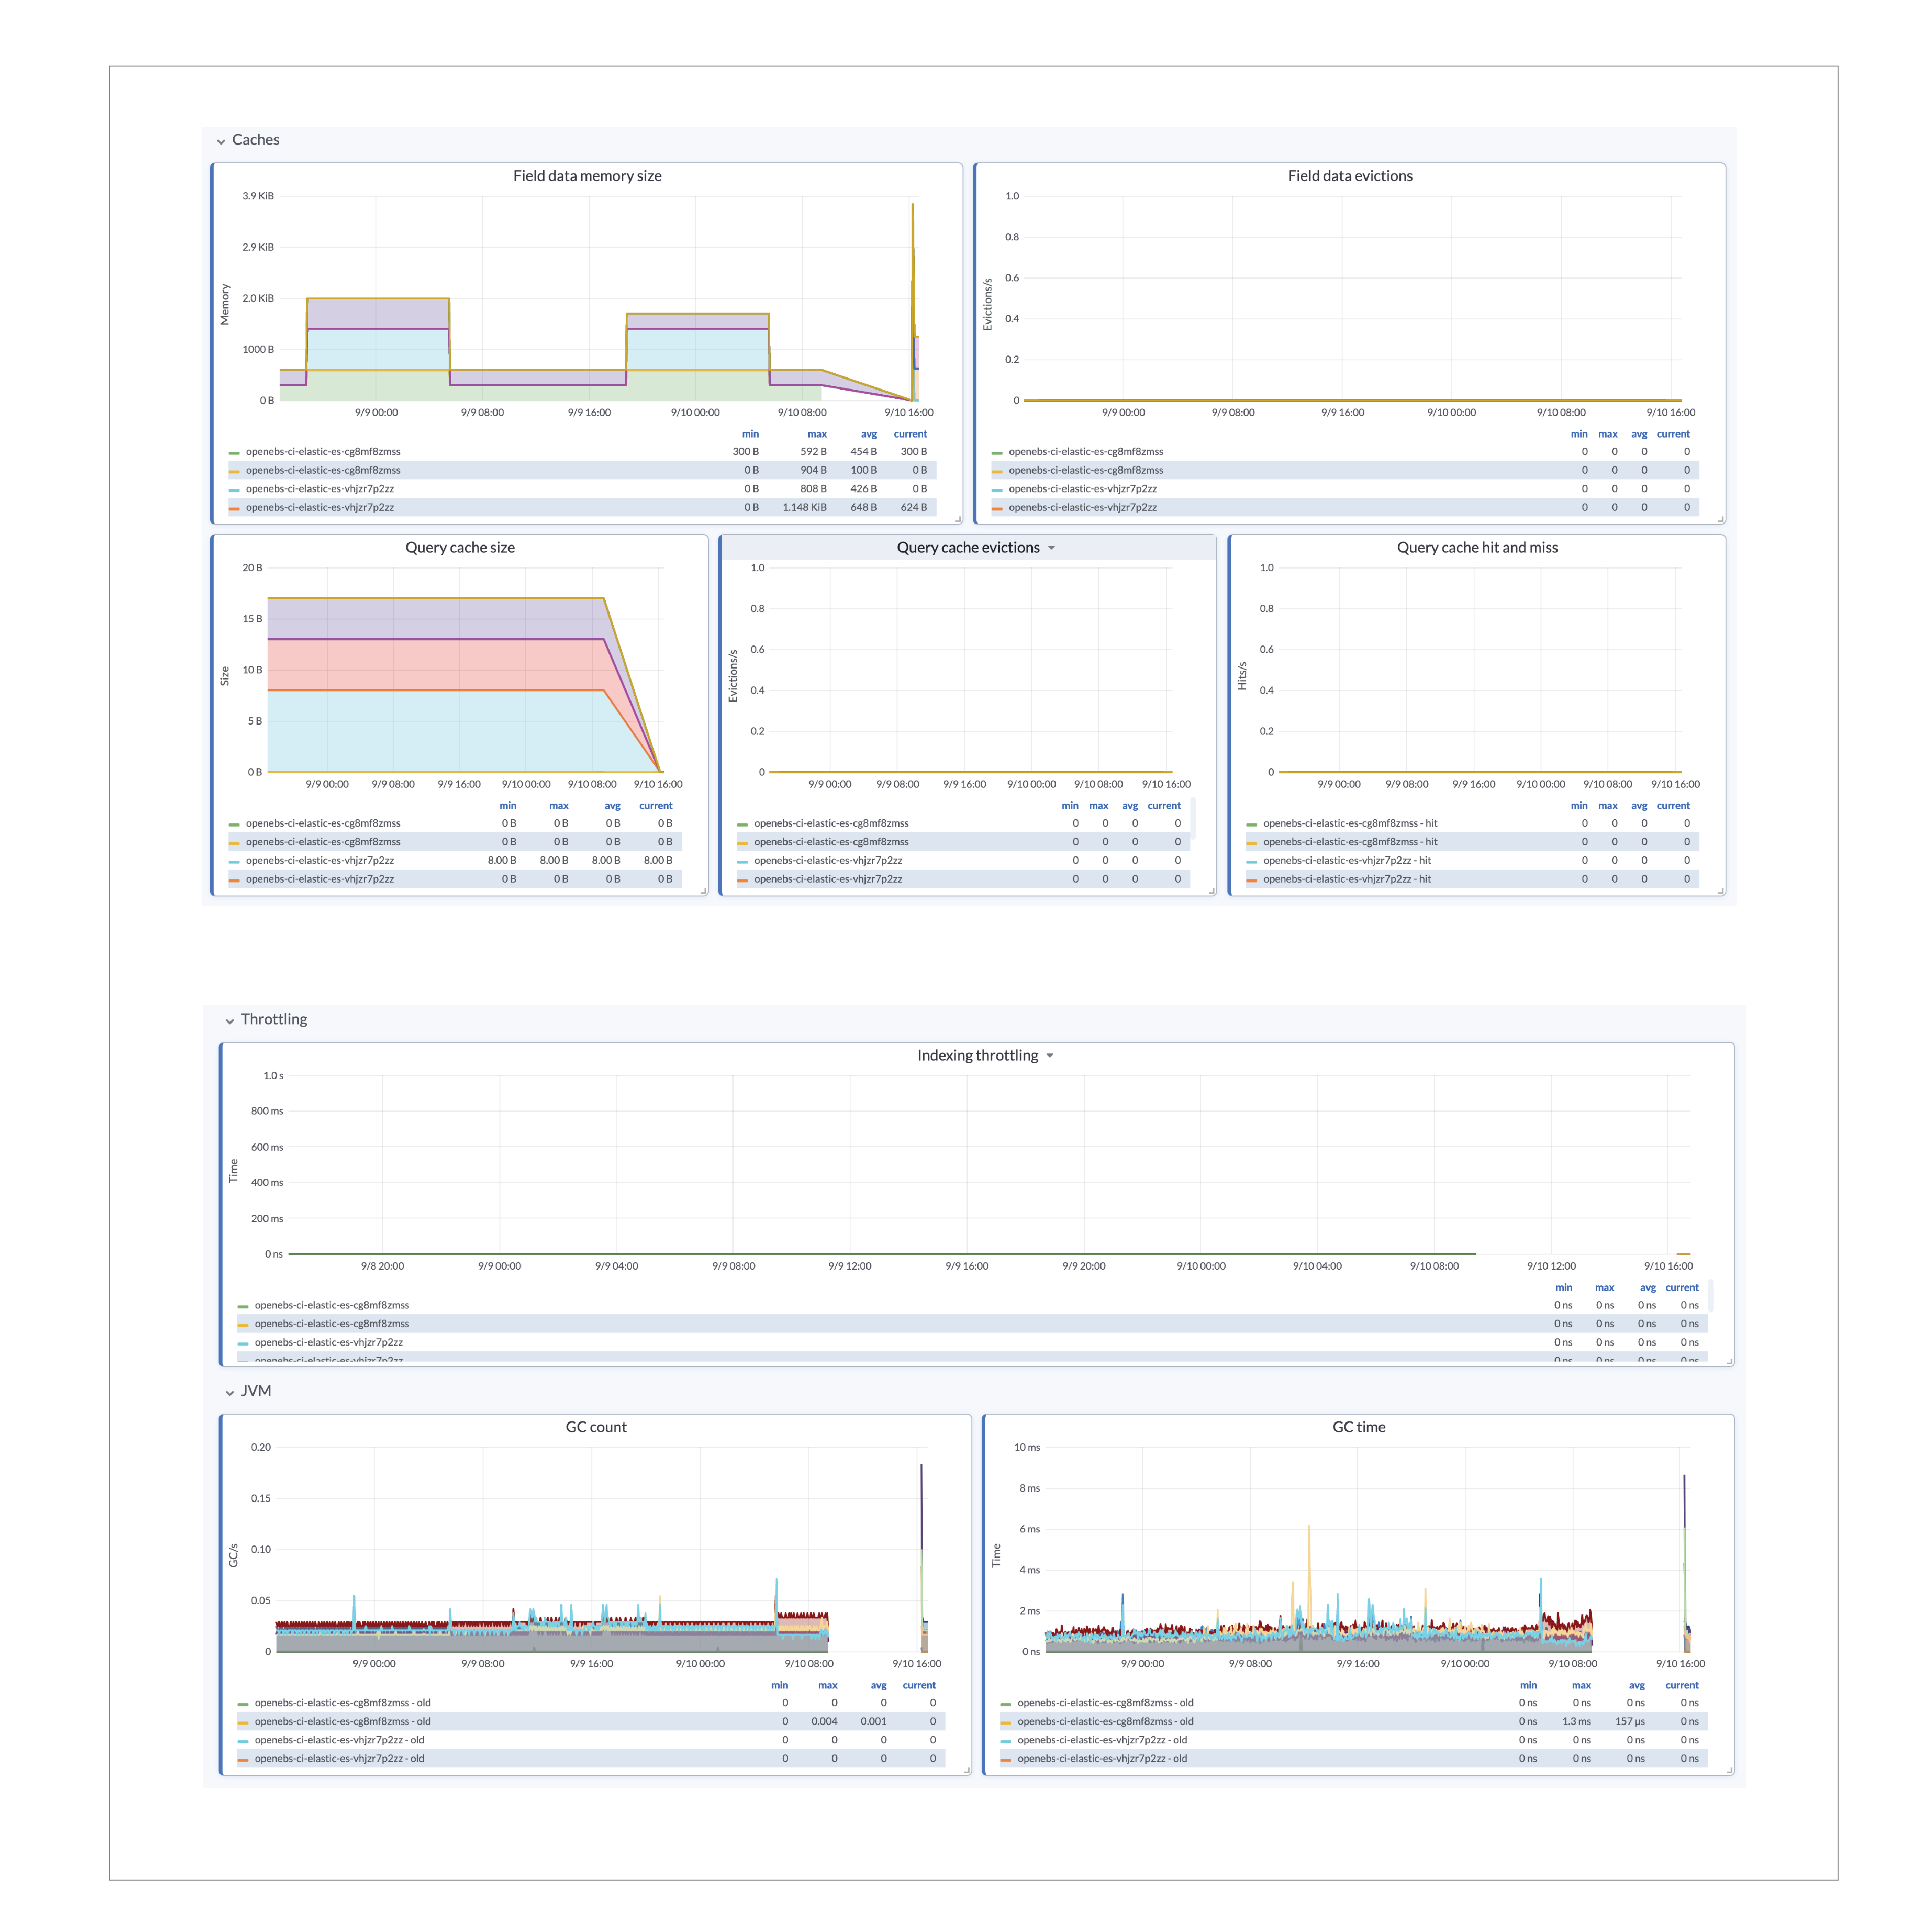
ElasticSearch DashBoard
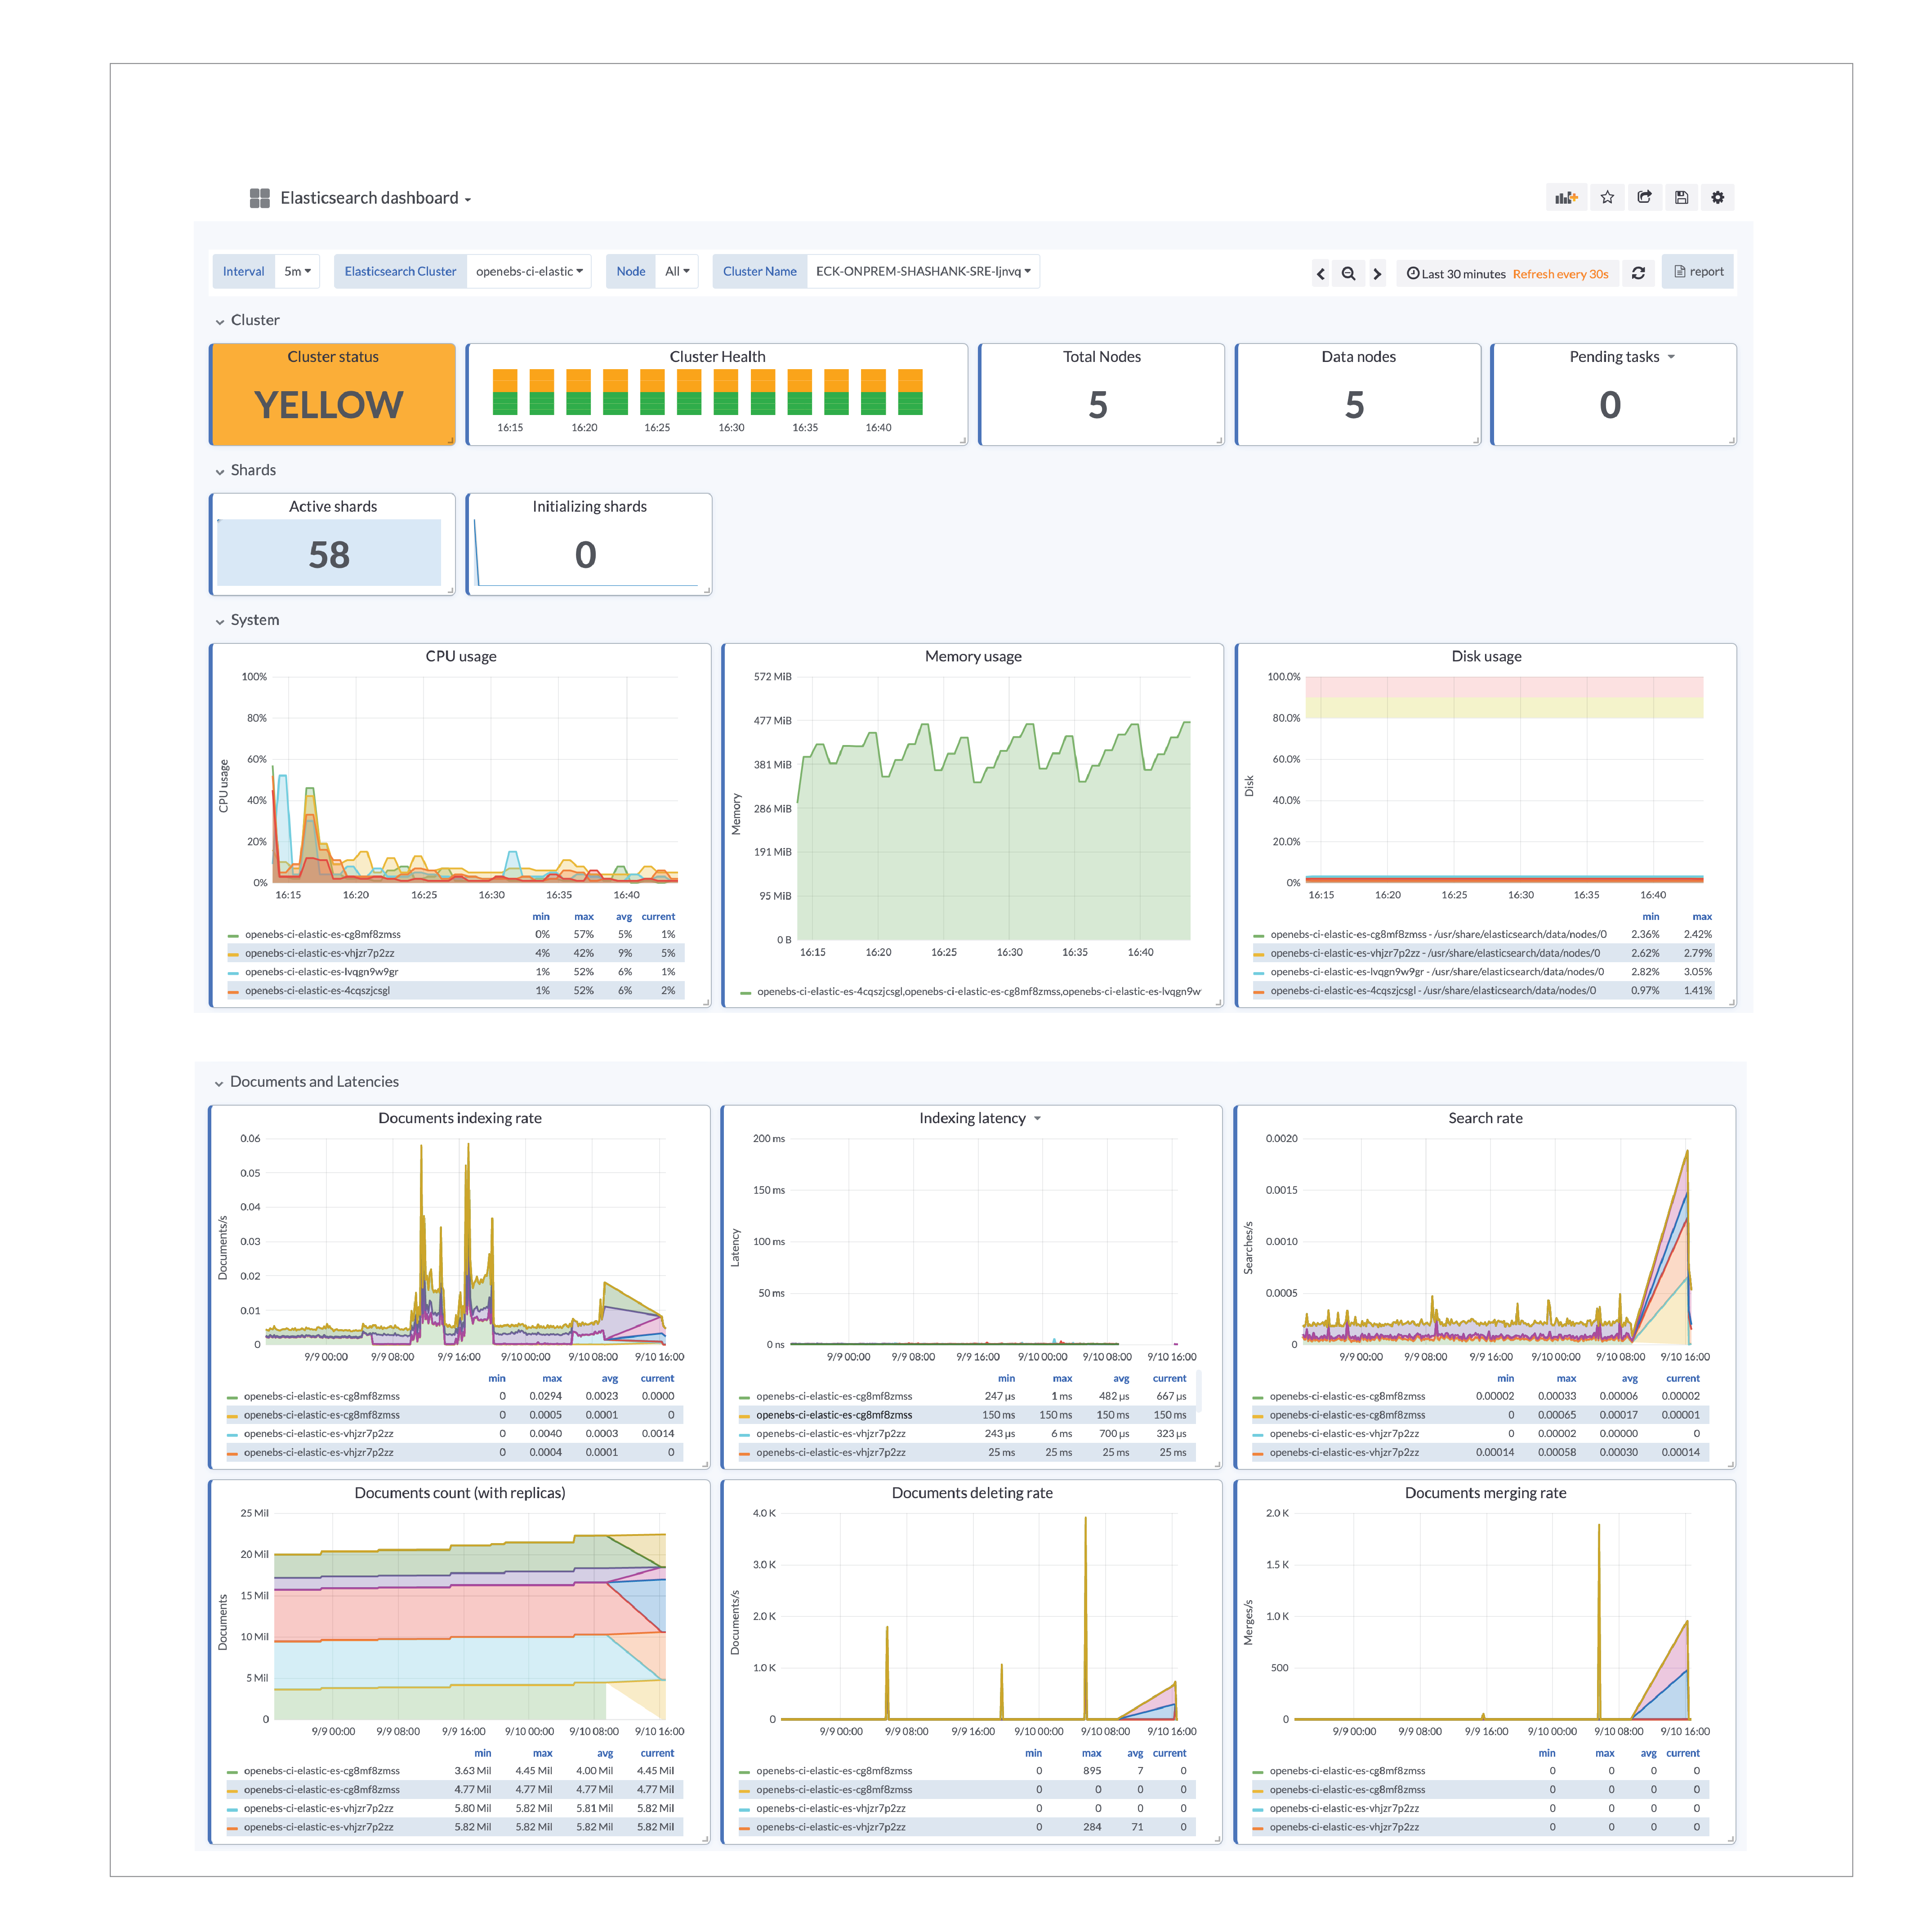
ElasticSearch DashBoard
If you face any issues, access free support at MayaData’s help center. Sign up to get access to the MayaData knowledge base and active OpenEBS user community.
Summary:
ElasticSearch users on Kubernetes can access MayaData’s free hosted monitoring at director.mayadata.io. Use OpenEBS LocalPV for an easy and scalable ElasticSearch deployment. Sign up now at MayaData to get free forever tier of Kubernetes visibility, control, and application monitoring.
Important links:
Join the OpenEBS community - slack.openebs.io


Game changer in Container and Storage Paradigm- MayaData gets acquired by DataCore Software
Don Williams
Don Williams
Managing Ephemeral Storage on Kubernetes with OpenEBS
Kiran Mova
Kiran Mova
Understanding Persistent Volumes and PVCs in Kubernetes & OpenEBS
Murat Karslioglu
Murat Karslioglu