

I'm a Developer Advocate at MayaData, a company dedicated to enabling data agility through the use of Kubernetes as a data layer and the sponsor of the CNCF project OpenEBS and other open source projects. Take it for a test drive via free and easy to use management software by registering here.
Let's get started - in my last blog post, I showed a Kafka cluster graph, and you may have noticed that it was, well, filling up. Generally speaking, you don’t want to use Kafka as a long term data store, it’s really for processing and temporarily storing data. So we need a different place to store all this data that’s in Kafka.
Depending on what you’re storing, you might want to use any number of different databases. Cassandra is a favorite, as is Postgres, and both work nicely in Kubernetes using OpenEBS, though in very different ways. Cassandra, for example, is a “No-SQL DB” that characteristically handles its own replication, and generally scales out rather than up, making it perfect for continuously growing datasets. Whereas Postgres and other relational DBs generally scale-up, and sit on a single storage device (which needs to be replicated for redundancy, of course, but that’s a story for another sprint). Our topic for this week, however, is Elasticsearch.
Elasticsearch is really good at returning searches on any field quickly, but without worrying too much about which fields get indexed and which have to be full-text searched. As it happens, that’s just what I’m looking for for my next project.
Getting ready with ElasticSearch prerequisites
So I’m trying to get Elasticsearch in my cluster. Of course, my little i3-large nodes can’t run Kafka and elastic side-by-side, so:
kops edit ig nodes # to bump minSize and maxSize
kops update cluster --yes && watch kubectl get nodes
It takes a little while for my system-setup daemonset to finish setting up that zfs pool on the new nodes. About 7m23s to be more precise. At that point, I can scale down the elastic sts that never came up due to lack of resources, delete the old PVCs to free the scheduler up to place the app on the new nodes and watch the OOMKiller go to work ;^) Oh yeah, I did actually tune the limits down in an attempt to get it to run on those nodes. Anyway:
Benchmarking ElasticSearch on Kubernetes
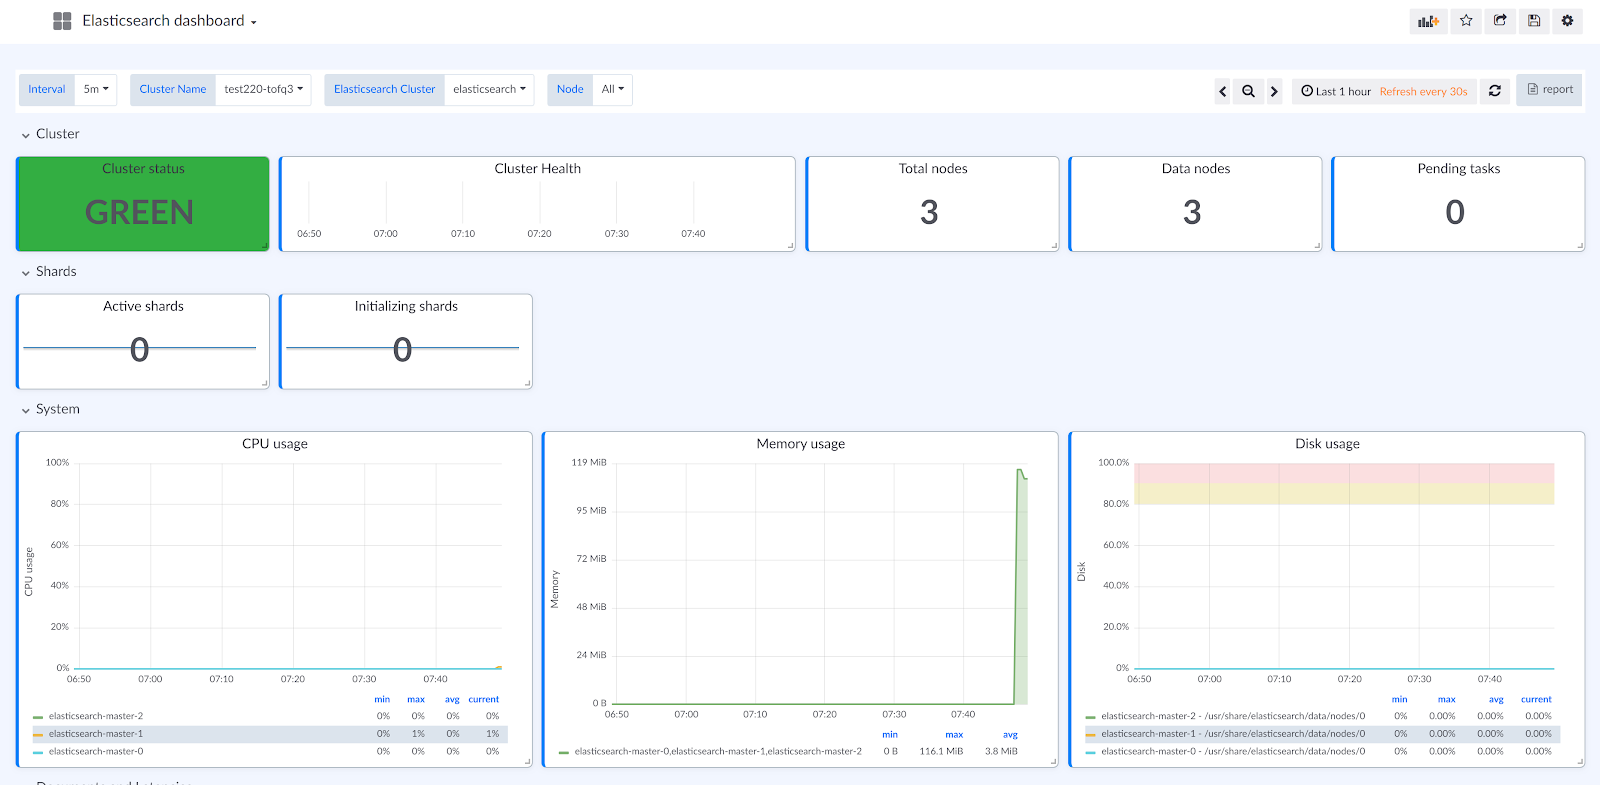
Now that I have elastic up and running, and have the Director’s Analytics dashboard enabled and collecting data, let’s fire up a Debian pod, and use the rally to heat the system up a little bit:
root@workstation-7cd6d9f68f-dtwqj:~/.rally/logs# esrally race --pipeline benchmark-only --track geonames --target-hosts elasticsearch-master
    ____        ____
   / __ \____ _/ / /_  __
  / /_/ / __ `/ / / / / /
 / _, _/ /_/ / / / /_/ /
/_/ |_|\__,_/_/_/\__, /
                /____/


************************************************************************
************** WARNING: A dark dungeon lies ahead of you  **************
************************************************************************

Rally does not have control over the configuration of the benchmarked
Elasticsearch cluster.

Be aware that results may be misleading due to problems with the setup.
Rally is also not able to gather lots of metrics at all (like CPU usage
of the benchmarked cluster) or may even produce misleading metrics (like
the index size).

************************************************************************
****** Use this pipeline only if you are aware of the tradeoffs.  ******
*************************** Watch your step! ***************************
************************************************************************

[INFO] Downloading data for track geonames (252.9 MB total size)                  [100.0%]
[INFO] Decompressing track data from [/root/.rally/benchmarks/data/geonames/documents-2.json.bz2] to [/root/.rally/benchmarks/data/geonames/documents-2.json] (resulting size: 3.30 GB) ...
7036 seconds later…
…
|      Min Throughput |      index-append |     14855.8 |  docs/s |
|   Median Throughput |      index-append |     16770.6 |  docs/s |
|      Max Throughput |      index-append |     17771.9 |  docs/s |
…
Hrm. https://elasticsearch-benchmarks.elastic.co/#tracks/geonames/nightly/default/30d says we should see more like 80k.
Let’s see about giving it more resources. I’ll run it on some i3xlarge nodes, give it 3 CPUs and, say, 20G of RAM. That should at least make sure it’s not memory bound since the whole dataset is only 3g.
|      Min Throughput |       index-append |    16704.5 |  docs/s |
|   Median Throughput |       index-append |    19313.4 |  docs/s |
|      Max Throughput |       index-append |    21217.4 |  docs/s |
Okay, one more time…
|      Min Throughput |       index-append |     35191.3 |  docs/s |
|   Median Throughput |       index-append |     36285.6 |  docs/s |
|      Max Throughput |       index-append |     37512.9 |  docs/s |
Curses! Not consistent, and still not fast enough. How do they get those numbers? Those rally guys weren’t kidding when they said: “a dark dungeon lies ahead.”
So as far as I understand it, these throughput metrics are measuring how fast you can get documents into the elastic search system. There are a bunch of other metrics that could be important to an app. So, this is just the first turn in our trip through the dark dungeon, and there’s only so much time in this sprint ;^)
So when that index-append operation kicks off, rally shoves a bunch (3.3 gigabytes worth) of documents at the system and sees how fast it goes. It seems to go a little bit faster with more CPU, and based on the Grafana dashboard (wait, is there a bug in the documents indexing rate in this dashboard? Let’s just go ahead and fix that).
Well, we get what we get, and based on what we see in the graphs, there’s no need to give it that much ram, and it’s probably CPU bound.
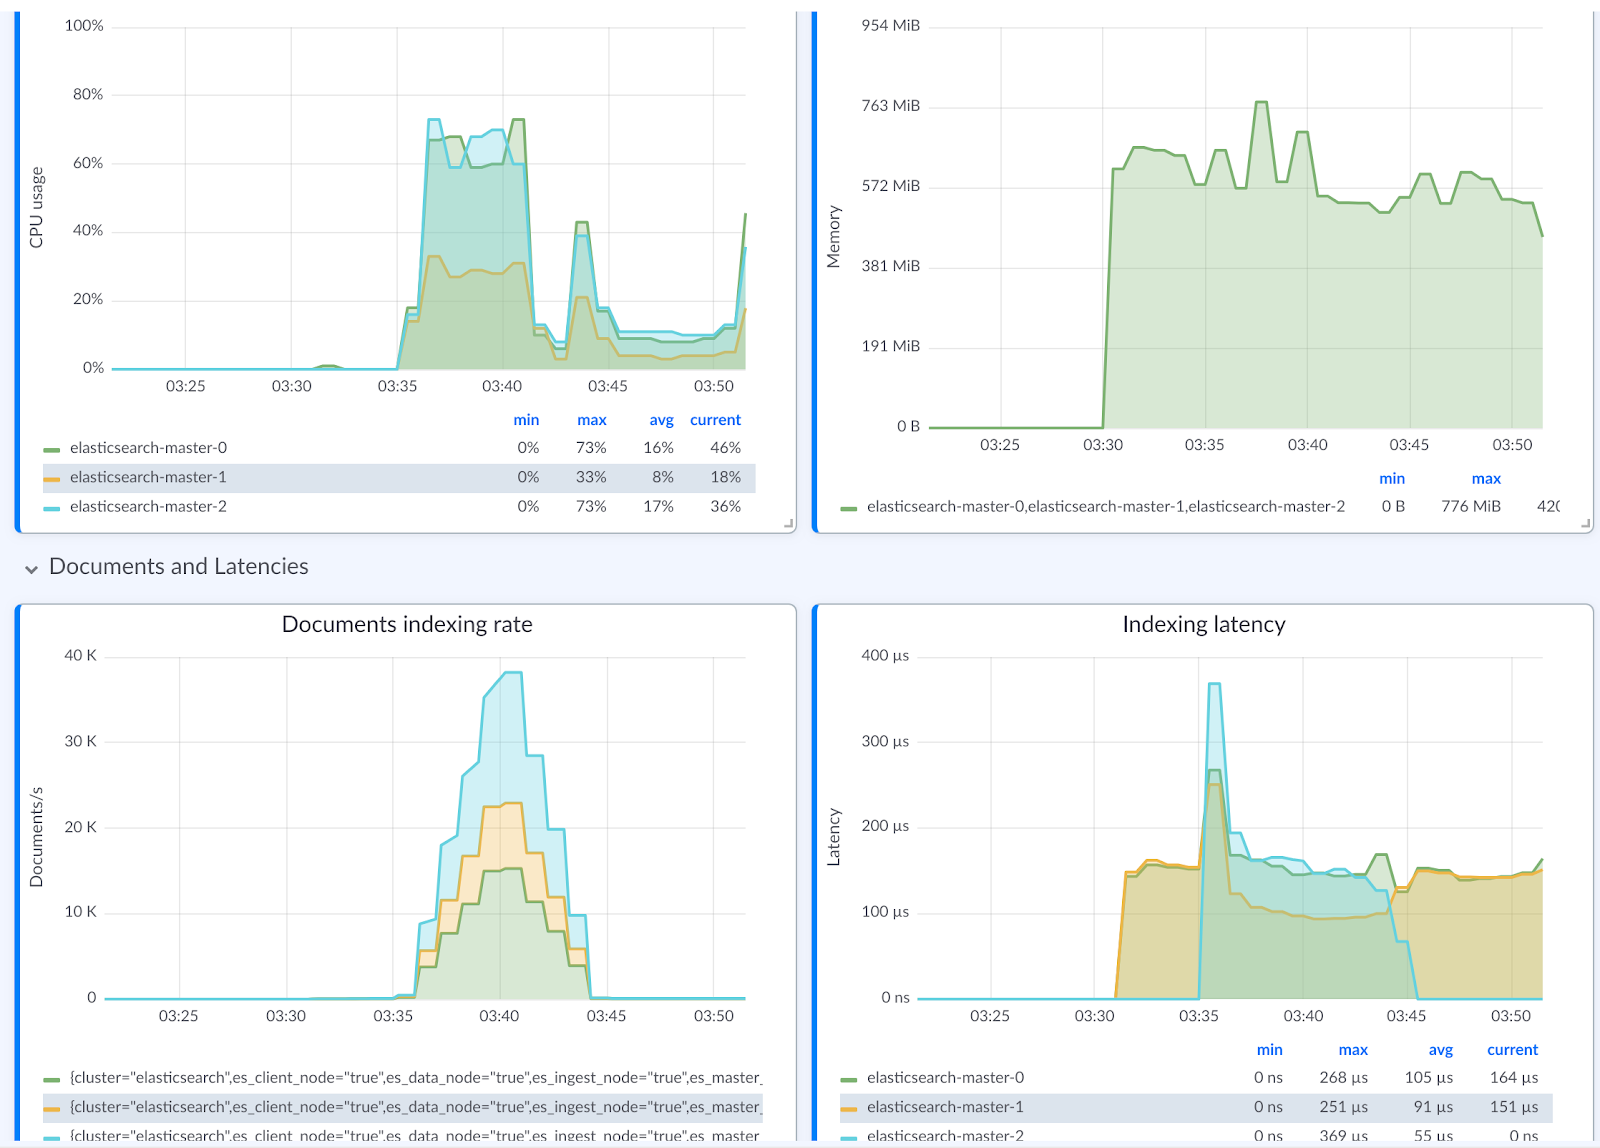
Maybe in the next sprint, we’ll hit 100k docs/s. But then the metric of interest will change to reducing the indexing latency, improving the lookup time, there’s no end in sight. Get me out of this dungeon!
The important thing is that it keeps up with the data we’re sending into Kafka and that Kafka has easy connectors into Elasticsearch, and (and this is probably the most important thing) we can tell if something is getting backed up somewhere and get alerted on it.
Check out the elasticsearch resources HERE for more info on getting elastic up and running on OpenEBS.
root@workstation-7cd6d9f68f-dtwqj:~/.rally/logs# esrally race --pipeline benchmark-only --track geonames --target-hosts elasticsearch-master

    ____        ____
   / __ \____ _/ / /_  __
  / /_/ / __ `/ / / / / /
 / _, _/ /_/ / / / /_/ /
/_/ |_|\__,_/_/_/\__, /
                /____/


************************************************************************
************** WARNING: A dark dungeon lies ahead of you  **************
************************************************************************

Rally does not have control over the configuration of the benchmarked
Elasticsearch cluster.

Be aware that results may be misleading due to problems with the setup.
Rally is also not able to gather lots of metrics at all (like CPU usage
of the benchmarked cluster) or may even produce misleading metrics (like
the index size).

************************************************************************
****** Use this pipeline only if you are aware of the tradeoffs.  ******
*************************** Watch your step! ***************************
************************************************************************

[INFO] Downloading data for track geonames (252.9 MB total size)                  [100.0%]
[INFO] Decompressing track data from [/root/.rally/benchmarks/data/geonames/documents-2.json.bz2] to [/root/.rally/benchmarks/data/geonames/documents-2.json] (resulting size: 3.30 GB) ... [OK]
[INFO] Preparing file offset table for [/root/.rally/benchmarks/data/geonames/documents-2.json] ... [OK]
[INFO] Racing on track [geonames], challenge [append-no-conflicts] and car ['external'] with version [7.6.2].
Running delete-index                                                           [100% done]
Running create-index                                                           [100% done]
Running check-cluster-health                                                   [100% done]
Running index-append                                                           [100% done]
Running refresh-after-index                                                    [100% done]
Running force-merge                                                            [100% done]
Running refresh-after-force-merge                                              [100% done]
Running wait-until-merges-finish                                               [100% done]
Running index-stats                                                            [100% done]
Running node-stats                                                             [100% done]
Running default                                                                [100% done]
Running term                                                                   [100% done]
Running phrase                                                                 [100% done]
Running country_agg_uncached                                                   [100% done]
Running country_agg_cached                                                     [100% done]
Running scroll                                                                 [100% done]
Running expression                                                             [100% done]
Running painless_static                                                        [100% done]
Running painless_dynamic                                                       [100% done]
Running decay_geo_gauss_function_score                                         [100% done]
Running decay_geo_gauss_script_score                                           [100% done]
Running field_value_function_score                                             [100% done]
Running field_value_script_score                                               [100% done]
Running random_function_score                                                  [100% done]
Running random_script_score                                                    [100% done]
Running large_terms                                                            [100% done]
Running large_filtered_terms                                                   [100% done]
Running large_prohibited_terms                                                 [100% done]
Running desc_sort_population                                                   [100% done]
Running asc_sort_population                                                    [100% done]
Running desc_sort_geonameid                                                    [100% done]
Running asc_sort_geonameid                                                     [100% done]

------------------------------------------------------
    _______             __   _____
   / ____(_)___  ____ _/ /  / ___/_________  ________
  / /_  / / __ \/ __ `/ /   \__ \/ ___/ __ \/ ___/ _ \
 / __/ / / / / / /_/ / /   ___/ / /__/ /_/ / /  /  __/
/_/   /_/_/ /_/\__,_/_/   /____/\___/\____/_/   \___/
------------------------------------------------------
| Metric | Task | Value | Unit |
|---------------------------------------------------------------:|-------------------------------:|------------:|--------:|
| Cumulative indexing time of primary shards | | 24.7743 | min |
| Min cumulative indexing time across primary shards | | 3.72207 | min |
| Median cumulative indexing time across primary shards | | 5.19625 | min |
| Max cumulative indexing time across primary shards | | 5.35337 | min |
| Cumulative indexing throttle time of primary shards | | 0 | min |
| Min cumulative indexing throttle time across primary shards | | 0 | min |
| Median cumulative indexing throttle time across primary shards | | 0 | min |
| Max cumulative indexing throttle time across primary shards | | 0 | min |
| Cumulative merge time of primary shards | | 6.78998 | min |
| Cumulative merge count of primary shards | | 5 | |
| Min cumulative merge time across primary shards | | 0.129767 | min |
| Median cumulative merge time across primary shards | | 1.68235 | min |
| Max cumulative merge time across primary shards | | 2.11948 | min |
| Cumulative merge throttle time of primary shards | | 0.480417 | min |
| Min cumulative merge throttle time across primary shards | | 0 | min |
| Median cumulative merge throttle time across primary shards | | 0.108383 | min |
| Max cumulative merge throttle time across primary shards | | 0.146633 | min |
| Cumulative refresh time of primary shards | | 10.0614 | min |
| Cumulative refresh count of primary shards | | 143 | |
| Min cumulative refresh time across primary shards | | 0.1789 | min |
| Median cumulative refresh time across primary shards | | 2.404 | min |
| Max cumulative refresh time across primary shards | | 2.5728 | min |
| Cumulative flush time of primary shards | | 0.443233 | min |
| Cumulative flush count of primary shards | | 10 | |
| Min cumulative flush time across primary shards | | 0.05465 | min |
| Median cumulative flush time across primary shards | | 0.0644667 | min |
| Max cumulative flush time across primary shards | | 0.147817 | min |
| Total Young Gen GC | | 277.827 | s |
| Total Old Gen GC | | 3.592 | s |
| Store size | | 2.99306 | GB |
| Translog size | | 2.56114e-07 | GB |
| Heap used for segments | | 4.31637 | MB |
| Heap used for doc values | | 0.0281105 | MB |
| Heap used for terms | | 3.45172 | MB |
| Heap used for norms | | 0.0626831 | MB |
| Heap used for points | | 0 | MB |
| Heap used for stored fields | | 0.773857 | MB |
| Segment count | | 81 | |
| Min Throughput | index-append | 11303 | docs/s |
| Median Throughput | index-append | 15436 | docs/s |
| Max Throughput | index-append | 16606.8 | docs/s |
| 50th percentile latency | index-append | 2126.69 | ms |
| 90th percentile latency | index-append | 4427.12 | ms |
| 99th percentile latency | index-append | 7152.45 | ms |
| 99.9th percentile latency | index-append | 7735.62 | ms |
| 100th percentile latency | index-append | 7919.97 | ms |
| 50th percentile service time | index-append | 2126.69 | ms |
| 90th percentile service time | index-append | 4427.12 | ms |
| 99th percentile service time | index-append | 7152.45 | ms |
| 99.9th percentile service time | index-append | 7735.62 | ms |
| 100th percentile service time | index-append | 7919.97 | ms |
| error rate | index-append | 0 | % |
| Min Throughput | index-stats | 90.04 | ops/s |
| Median Throughput | index-stats | 90.06 | ops/s |
| Max Throughput | index-stats | 90.13 | ops/s |
| 50th percentile latency | index-stats | 2.84174 | ms |
| 90th percentile latency | index-stats | 6.94165 | ms |
| 99th percentile latency | index-stats | 13.0146 | ms |
| 99.9th percentile latency | index-stats | 22.2647 | ms |
| 100th percentile latency | index-stats | 29.2606 | ms |
| 50th percentile service time | index-stats | 2.67067 | ms |
| 90th percentile service time | index-stats | 5.15701 | ms |
| 99th percentile service time | index-stats | 11.2044 | ms |
| 99.9th percentile service time | index-stats | 15.6928 | ms |
| 100th percentile service time | index-stats | 16.5849 | ms |
| error rate | index-stats | 0 | % |
| Min Throughput | node-stats | 89.82 | ops/s |
| Median Throughput | node-stats | 90.04 | ops/s |
| Max Throughput | node-stats | 90.31 | ops/s |
| 50th percentile latency | node-stats | 4.03152 | ms |
| 90th percentile latency | node-stats | 8.8417 | ms |
| 99th percentile latency | node-stats | 20.1257 | ms |
| 99.9th percentile latency | node-stats | 28.1515 | ms |
| 100th percentile latency | node-stats | 29.0358 | ms |
| 50th percentile service time | node-stats | 3.8443 | ms |
| 90th percentile service time | node-stats | 6.8544 | ms |
| 99th percentile service time | node-stats | 18.5385 | ms |
| 99.9th percentile service time | node-stats | 27.0782 | ms |
| 100th percentile service time | node-stats | 28.0155 | ms |
| error rate | node-stats | 0 | % |
| Min Throughput | default | 50.02 | ops/s |
| Median Throughput | default | 50.04 | ops/s |
| Max Throughput | default | 50.08 | ops/s |
| 50th percentile latency | default | 3.09639 | ms |
| 90th percentile latency | default | 5.21394 | ms |
| 99th percentile latency | default | 14.2784 | ms |
| 99.9th percentile latency | default | 17.9219 | ms |
| 100th percentile latency | default | 30.0705 | ms |
| 50th percentile service time | default | 2.96016 | ms |
| 90th percentile service time | default | 4.9901 | ms |
| 99th percentile service time | default | 13.0786 | ms |
| 99.9th percentile service time | default | 16.7214 | ms |
| 100th percentile service time | default | 29.936 | ms |
| error rate | default | 0 | % |
| Min Throughput | term | 146.13 | ops/s |
| Median Throughput | term | 149.88 | ops/s |
| Max Throughput | term | 150.09 | ops/s |
| 50th percentile latency | term | 4.94894 | ms |
| 90th percentile latency | term | 123.777 | ms |
| 99th percentile latency | term | 232.824 | ms |
| 99.9th percentile latency | term | 240.153 | ms |
| 100th percentile latency | term | 241.924 | ms |
| 50th percentile service time | term | 3.56478 | ms |
| 90th percentile service time | term | 7.88877 | ms |
| 99th percentile service time | term | 20.0056 | ms |
| 99.9th percentile service time | term | 35.5678 | ms |
| 100th percentile service time | term | 80.1563 | ms |
| error rate | term | 0 | % |
| Min Throughput | phrase | 103.96 | ops/s |
| Median Throughput | phrase | 119.88 | ops/s |
| Max Throughput | phrase | 133.51 | ops/s |
| 50th percentile latency | phrase | 1519.45 | ms |
| 90th percentile latency | phrase | 1860.28 | ms |
| 99th percentile latency | phrase | 1901.4 | ms |
| 99.9th percentile latency | phrase | 1910.33 | ms |
| 100th percentile latency | phrase | 1912.98 | ms |
| 50th percentile service time | phrase | 3.62691 | ms |
| 90th percentile service time | phrase | 8.60332 | ms |
| 99th percentile service time | phrase | 45.3735 | ms |
| 99.9th percentile service time | phrase | 81.7154 | ms |
| 100th percentile service time | phrase | 217.686 | ms |
| error rate | phrase | 0 | % |
| Min Throughput | country_agg_uncached | 1.44 | ops/s |
| Median Throughput | country_agg_uncached | 1.45 | ops/s |
| Max Throughput | country_agg_uncached | 1.46 | ops/s |
| 50th percentile latency | country_agg_uncached | 109942 | ms |
| 90th percentile latency | country_agg_uncached | 126200 | ms |
| 99th percentile latency | country_agg_uncached | 129696 | ms |
| 100th percentile latency | country_agg_uncached | 130126 | ms |
| 50th percentile service time | country_agg_uncached | 664.898 | ms |
| 90th percentile service time | country_agg_uncached | 689.71 | ms |
| 99th percentile service time | country_agg_uncached | 913.481 | ms |
| 100th percentile service time | country_agg_uncached | 988.833 | ms |
| error rate | country_agg_uncached | 0 | % |
| Min Throughput | country_agg_cached | 100.03 | ops/s |
| Median Throughput | country_agg_cached | 100.05 | ops/s |
| Max Throughput | country_agg_cached | 100.08 | ops/s |
| 50th percentile latency | country_agg_cached | 2.35247 | ms |
| 90th percentile latency | country_agg_cached | 5.89225 | ms |
| 99th percentile latency | country_agg_cached | 11.2941 | ms |
| 99.9th percentile latency | country_agg_cached | 16.8824 | ms |
| 100th percentile latency | country_agg_cached | 18.3066 | ms |
| 50th percentile service time | country_agg_cached | 2.19644 | ms |
| 90th percentile service time | country_agg_cached | 4.36504 | ms |
| 99th percentile service time | country_agg_cached | 9.39305 | ms |
| 99.9th percentile service time | country_agg_cached | 14.6639 | ms |
| 100th percentile service time | country_agg_cached | 14.8167 | ms |
| error rate | country_agg_cached | 0 | % |
| Min Throughput | scroll | 20.02 | pages/s |
| Median Throughput | scroll | 20.04 | pages/s |
| Max Throughput | scroll | 20.05 | pages/s |
| 50th percentile latency | scroll | 646.462 | ms |
| 90th percentile latency | scroll | 779.249 | ms |
| 99th percentile latency | scroll | 942.19 | ms |
| 100th percentile latency | scroll | 1016.53 | ms |
| 50th percentile service time | scroll | 646.077 | ms |
| 90th percentile service time | scroll | 778.543 | ms |
| 99th percentile service time | scroll | 941.516 | ms |
| 100th percentile service time | scroll | 1015.89 | ms |
| error rate | scroll | 0 | % |
| Min Throughput | expression | 0.67 | ops/s |
| Median Throughput | expression | 0.67 | ops/s |
| Max Throughput | expression | 0.67 | ops/s |
| 50th percentile latency | expression | 248789 | ms |
| 90th percentile latency | expression | 287953 | ms |
| 99th percentile latency | expression | 296692 | ms |
| 100th percentile latency | expression | 297678 | ms |
| 50th percentile service time | expression | 1490.05 | ms |
| 90th percentile service time | expression | 1515.21 | ms |
| 99th percentile service time | expression | 1559.38 | ms |
| 100th percentile service time | expression | 1622.96 | ms |
| error rate | expression | 0 | % |
| Min Throughput | painless_static | 0.58 | ops/s |
| Median Throughput | painless_static | 0.58 | ops/s |
| Max Throughput | painless_static | 0.58 | ops/s |
| 50th percentile latency | painless_static | 264875 | ms |
| 90th percentile latency | painless_static | 305529 | ms |
| 99th percentile latency | painless_static | 314497 | ms |
| 100th percentile latency | painless_static | 315524 | ms |
| 50th percentile service time | painless_static | 1697.5 | ms |
| 90th percentile service time | painless_static | 1727.3 | ms |
| 99th percentile service time | painless_static | 1803.76 | ms |
| 100th percentile service time | painless_static | 1853.43 | ms |
| error rate | painless_static | 0 | % |
| Min Throughput | painless_dynamic | 0.6 | ops/s |
| Median Throughput | painless_dynamic | 0.6 | ops/s |
| Max Throughput | painless_dynamic | 0.6 | ops/s |
| 50th percentile latency | painless_dynamic | 253206 | ms |
| 90th percentile latency | painless_dynamic | 293130 | ms |
| 99th percentile latency | painless_dynamic | 302013 | ms |
| 100th percentile latency | painless_dynamic | 302978 | ms |
| 50th percentile service time | painless_dynamic | 1674.56 | ms |
| 90th percentile service time | painless_dynamic | 1712.67 | ms |
| 99th percentile service time | painless_dynamic | 1736.34 | ms |
| 100th percentile service time | painless_dynamic | 1768.95 | ms |
| error rate | painless_dynamic | 0 | % |
| Min Throughput | decay_geo_gauss_function_score | 0.83 | ops/s |
| Median Throughput | decay_geo_gauss_function_score | 0.83 | ops/s |
| Max Throughput | decay_geo_gauss_function_score | 0.83 | ops/s |
| 50th percentile latency | decay_geo_gauss_function_score | 51653.8 | ms |
| 90th percentile latency | decay_geo_gauss_function_score | 59323.4 | ms |
| 99th percentile latency | decay_geo_gauss_function_score | 61119.6 | ms |
| 100th percentile latency | decay_geo_gauss_function_score | 61349.7 | ms |
| 50th percentile service time | decay_geo_gauss_function_score | 1198.21 | ms |
| 90th percentile service time | decay_geo_gauss_function_score | 1224.28 | ms |
| 99th percentile service time | decay_geo_gauss_function_score | 1289.06 | ms |
| 100th percentile service time | decay_geo_gauss_function_score | 1290.39 | ms |
| error rate | decay_geo_gauss_function_score | 0 | % |
| Min Throughput | decay_geo_gauss_script_score | 0.83 | ops/s |
| Median Throughput | decay_geo_gauss_script_score | 0.83 | ops/s |
| Max Throughput | decay_geo_gauss_script_score | 0.83 | ops/s |
| 50th percentile latency | decay_geo_gauss_script_score | 51381.1 | ms |
| 90th percentile latency | decay_geo_gauss_script_score | 58998.6 | ms |
| 99th percentile latency | decay_geo_gauss_script_score | 60780.6 | ms |
| 100th percentile latency | decay_geo_gauss_script_score | 60971.4 | ms |
| 50th percentile service time | decay_geo_gauss_script_score | 1194.91 | ms |
| 90th percentile service time | decay_geo_gauss_script_score | 1212.85 | ms |
| 99th percentile service time | decay_geo_gauss_script_score | 1268.43 | ms |
| 100th percentile service time | decay_geo_gauss_script_score | 1276.25 | ms |
| error rate | decay_geo_gauss_script_score | 0 | % |
| Min Throughput | field_value_function_score | 1.5 | ops/s |
| Median Throughput | field_value_function_score | 1.5 | ops/s |
| Max Throughput | field_value_function_score | 1.5 | ops/s |
| 50th percentile latency | field_value_function_score | 597.142 | ms |
| 90th percentile latency | field_value_function_score | 640.82 | ms |
| 99th percentile latency | field_value_function_score | 661.276 | ms |
| 100th percentile latency | field_value_function_score | 676.446 | ms |
| 50th percentile service time | field_value_function_score | 596.961 | ms |
| 90th percentile service time | field_value_function_score | 640.639 | ms |
| 99th percentile service time | field_value_function_score | 661.126 | ms |
| 100th percentile service time | field_value_function_score | 676.286 | ms |
| error rate | field_value_function_score | 0 | % |
| Min Throughput | field_value_script_score | 1.3 | ops/s |
| Median Throughput | field_value_script_score | 1.31 | ops/s |
| Max Throughput | field_value_script_score | 1.31 | ops/s |
| 50th percentile latency | field_value_script_score | 25259.9 | ms |
| 90th percentile latency | field_value_script_score | 28959.3 | ms |
| 99th percentile latency | field_value_script_score | 29740.3 | ms |
| 100th percentile latency | field_value_script_score | 29837.1 | ms |
| 50th percentile service time | field_value_script_score | 765.042 | ms |
| 90th percentile service time | field_value_script_score | 781.964 | ms |
| 99th percentile service time | field_value_script_score | 797.338 | ms |
| 100th percentile service time | field_value_script_score | 810.518 | ms |
| error rate | field_value_script_score | 0 | % |
| Min Throughput | random_function_score | 0.77 | ops/s |
| Median Throughput | random_function_score | 0.77 | ops/s |
| Max Throughput | random_function_score | 0.77 | ops/s |
| 50th percentile latency | random_function_score | 158787 | ms |
| 90th percentile latency | random_function_score | 183672 | ms |
| 99th percentile latency | random_function_score | 189337 | ms |
| 100th percentile latency | random_function_score | 189949 | ms |
| 50th percentile service time | random_function_score | 1295.08 | ms |
| 90th percentile service time | random_function_score | 1324.14 | ms |
| 99th percentile service time | random_function_score | 1360.46 | ms |
| 100th percentile service time | random_function_score | 1366.75 | ms |
| error rate | random_function_score | 0 | % |
| Min Throughput | random_script_score | 0.8 | ops/s |
| Median Throughput | random_script_score | 0.8 | ops/s |
| Max Throughput | random_script_score | 0.8 | ops/s |
| 50th percentile latency | random_script_score | 147900 | ms |
| 90th percentile latency | random_script_score | 170890 | ms |
| 99th percentile latency | random_script_score | 175984 | ms |
| 100th percentile latency | random_script_score | 176511 | ms |
| 50th percentile service time | random_script_score | 1240.17 | ms |
| 90th percentile service time | random_script_score | 1283.05 | ms |
| 99th percentile service time | random_script_score | 1388.37 | ms |
| 100th percentile service time | random_script_score | 1519.15 | ms |
| error rate | random_script_score | 0 | % |
| Min Throughput | large_terms | 0.61 | ops/s |
| Median Throughput | large_terms | 0.62 | ops/s |
| Max Throughput | large_terms | 0.62 | ops/s |
| 50th percentile latency | large_terms | 240638 | ms |
| 90th percentile latency | large_terms | 277372 | ms |
| 99th percentile latency | large_terms | 285518 | ms |
| 100th percentile latency | large_terms | 286431 | ms |
| 50th percentile service time | large_terms | 1596.38 | ms |
| 90th percentile service time | large_terms | 1634.79 | ms |
| 99th percentile service time | large_terms | 1716.84 | ms |
| 100th percentile service time | large_terms | 1772.83 | ms |
| error rate | large_terms | 0 | % |
| Min Throughput | large_filtered_terms | 0.62 | ops/s |
| Median Throughput | large_filtered_terms | 0.62 | ops/s |
| Max Throughput | large_filtered_terms | 0.62 | ops/s |
| 50th percentile latency | large_filtered_terms | 239607 | ms |
| 90th percentile latency | large_filtered_terms | 277579 | ms |
| 99th percentile latency | large_filtered_terms | 286060 | ms |
| 100th percentile latency | large_filtered_terms | 287000 | ms |
| 50th percentile service time | large_filtered_terms | 1613.21 | ms |
| 90th percentile service time | large_filtered_terms | 1662.27 | ms |
| 99th percentile service time | large_filtered_terms | 2070.78 | ms |
| 100th percentile service time | large_filtered_terms | 2298.39 | ms |
| error rate | large_filtered_terms | 0 | % |
| Min Throughput | large_prohibited_terms | 0.65 | ops/s |
| Median Throughput | large_prohibited_terms | 0.65 | ops/s |
| Max Throughput | large_prohibited_terms | 0.65 | ops/s |
| 50th percentile latency | large_prohibited_terms | 216708 | ms |
| 90th percentile latency | large_prohibited_terms | 250656 | ms |
| 99th percentile latency | large_prohibited_terms | 258323 | ms |
| 100th percentile latency | large_prohibited_terms | 259188 | ms |
| 50th percentile service time | large_prohibited_terms | 1524.05 | ms |
| 90th percentile service time | large_prohibited_terms | 1562.55 | ms |
| 99th percentile service time | large_prohibited_terms | 1583.26 | ms |
| 100th percentile service time | large_prohibited_terms | 1583.54 | ms |
| error rate | large_prohibited_terms | 0 | % |
| Min Throughput | desc_sort_population | 1.5 | ops/s |
| Median Throughput | desc_sort_population | 1.5 | ops/s |
| Max Throughput | desc_sort_population | 1.51 | ops/s |
| 50th percentile latency | desc_sort_population | 210.766 | ms |
| 90th percentile latency | desc_sort_population | 250.21 | ms |
| 99th percentile latency | desc_sort_population | 282.964 | ms |
| 100th percentile latency | desc_sort_population | 308.846 | ms |
| 50th percentile service time | desc_sort_population | 210.191 | ms |
| 90th percentile service time | desc_sort_population | 249.607 | ms |
| 99th percentile service time | desc_sort_population | 282.888 | ms |
| 100th percentile service time | desc_sort_population | 308.271 | ms |
| error rate | desc_sort_population | 0 | % |
| Min Throughput | asc_sort_population | 1.5 | ops/s |
| Median Throughput | asc_sort_population | 1.5 | ops/s |
| Max Throughput | asc_sort_population | 1.51 | ops/s |
| 50th percentile latency | asc_sort_population | 224.286 | ms |
| 90th percentile latency | asc_sort_population | 263.111 | ms |
| 99th percentile latency | asc_sort_population | 284.96 | ms |
| 100th percentile latency | asc_sort_population | 311.084 | ms |
| 50th percentile service time | asc_sort_population | 223.676 | ms |
| 90th percentile service time | asc_sort_population | 262.546 | ms |
| 99th percentile service time | asc_sort_population | 284.388 | ms |
| 100th percentile service time | asc_sort_population | 309.006 | ms |
| error rate | asc_sort_population | 0 | % |
| Min Throughput | desc_sort_geonameid | 6.01 | ops/s |
| Median Throughput | desc_sort_geonameid | 6.02 | ops/s |
| Max Throughput | desc_sort_geonameid | 6.02 | ops/s |
| 50th percentile latency | desc_sort_geonameid | 19.2275 | ms |
| 90th percentile latency | desc_sort_geonameid | 77.8688 | ms |
| 99th percentile latency | desc_sort_geonameid | 80.8801 | ms |
| 100th percentile latency | desc_sort_geonameid | 81.0642 | ms |
| 50th percentile service time | desc_sort_geonameid | 19.0505 | ms |
| 90th percentile service time | desc_sort_geonameid | 76.5164 | ms |
| 99th percentile service time | desc_sort_geonameid | 80.6395 | ms |
| 100th percentile service time | desc_sort_geonameid | 80.9171 | ms |
| error rate | desc_sort_geonameid | 0 | % |
| Min Throughput | asc_sort_geonameid | 6.01 | ops/s |
| Median Throughput | asc_sort_geonameid | 6.02 | ops/s |
| Max Throughput | asc_sort_geonameid | 6.03 | ops/s |
| 50th percentile latency | asc_sort_geonameid | 6.11411 | ms |
| 90th percentile latency | asc_sort_geonameid | 47.9231 | ms |
| 99th percentile latency | asc_sort_geonameid | 89.5624 | ms |
| 100th percentile latency | asc_sort_geonameid | 93.2688 | ms |
| 50th percentile service time | asc_sort_geonameid | 5.81129 | ms |
| 90th percentile service time | asc_sort_geonameid | 47.7342 | ms |
| 99th percentile service time | asc_sort_geonameid | 89.3301 | ms |
| 100th percentile service time | asc_sort_geonameid | 93.085 | ms |
| error rate | asc_sort_geonameid | 0 | % |


----------------------------------
[INFO] SUCCESS (took 7036 seconds)
----------------------------------
And again!
root@workstation-7cd6d9f68f-2qz64:/# esrally race --pipeline benchmark-only --track geonames --target-hosts elasticsearch-master --car 16gheap

    ____        ____
   / __ \____ _/ / /_  __
  / /_/ / __ `/ / / / / /
 / _, _/ /_/ / / / /_/ /
/_/ |_|\__,_/_/_/\__, /
                /____/


************************************************************************
************** WARNING: A dark dungeon lies ahead of you  **************
************************************************************************

Rally does not have control over the configuration of the benchmarked
Elasticsearch cluster.

Be aware that results may be misleading due to problems with the setup.
Rally is also not able to gather lots of metrics at all (like CPU usage
of the benchmarked cluster) or may even produce misleading metrics (like
the index size).

************************************************************************
****** Use this pipeline only if you are aware of the tradeoffs.  ******
*************************** Watch your step! ***************************
************************************************************************

[INFO] Racing on track [geonames], challenge [append-no-conflicts] and car ['external'] with version [7.6.2].

[WARNING] merges_total_time is 251302 ms indicating that the cluster is not in a defined clean state. Recorded index time metrics may be misleading.
[WARNING] merges_total_throttled_time is 90511 ms indicating that the cluster is not in a defined clean state. Recorded index time metrics may be misleading.
[WARNING] indexing_total_time is 194528 ms indicating that the cluster is not in a defined clean state. Recorded index time metrics may be misleading.
[WARNING] refresh_total_time is 248438 ms indicating that the cluster is not in a defined clean state. Recorded index time metrics may be misleading.
[WARNING] flush_total_time is 2016 ms indicating that the cluster is not in a defined clean state. Recorded index time metrics may be misleading.
Running delete-index                                                           [100% done]
Running create-index                                                           [100% done]
Running check-cluster-health                                                   [100% done]
Running index-append                                                           [100% done]
Running refresh-after-index                                                    [100% done]
Running force-merge                                                            [100% done]
Running refresh-after-force-merge                                              [100% done]
Running wait-until-merges-finish                                               [100% done]
Running index-stats                                                            [100% done]
Running node-stats                                                             [100% done]
Running default                                                                [100% done]
Running term                                                                   [100% done]
Running phrase                                                                 [100% done]
Running country_agg_uncached                                                   [100% done]
Running country_agg_cached                                                     [100% done]
Running scroll                                                                 [100% done]
Running expression                                                             [100% done]
Running painless_static                                                        [100% done]
Running painless_dynamic                                                       [100% done]
Running decay_geo_gauss_function_score                                         [100% done]
Running decay_geo_gauss_script_score                                           [100% done]
Running field_value_function_score                                             [100% done]
Running field_value_script_score                                               [100% done]
Running random_function_score                                                  [100% done]
Running random_script_score                                                    [100% done]
Running large_terms                                                            [100% done]
Running large_filtered_terms                                                   [100% done]
Running large_prohibited_terms                                                 [100% done]
Running desc_sort_population                                                   [100% done]
Running asc_sort_population                                                    [100% done]
Running desc_sort_geonameid                                                    [100% done]
Running asc_sort_geonameid                                                     [100% done]

------------------------------------------------------
    _______             __   _____
   / ____(_)___  ____ _/ /  / ___/_________  ________
  / /_  / / __ \/ __ `/ /   \__ \/ ___/ __ \/ ___/ _ \
 / __/ / / / / / /_/ / /   ___/ / /__/ /_/ / /  /  __/
/_/   /_/_/ /_/\__,_/_/   /____/\___/\____/_/   \___/
------------------------------------------------------
| Metric | Task | Value | Unit |
|---------------------------------------------------------------:|-------------------------------:|------------:|--------:|
| Cumulative indexing time of primary shards | | 30.8521 | min |
| Min cumulative indexing time across primary shards | | 0 | min |
| Median cumulative indexing time across primary shards | | 3.75987 | min |
| Max cumulative indexing time across primary shards | | 5.98763 | min |
| Cumulative indexing throttle time of primary shards | | 0 | min |
| Min cumulative indexing throttle time across primary shards | | 0 | min |
| Median cumulative indexing throttle time across primary shards | | 0 | min |
| Max cumulative indexing throttle time across primary shards | | 0 | min |
| Cumulative merge time of primary shards | | 11.7582 | min |
| Cumulative merge count of primary shards | | 870 | |
| Min cumulative merge time across primary shards | | 0 | min |
| Median cumulative merge time across primary shards | | 0.781067 | min |
| Max cumulative merge time across primary shards | | 4.5766 | min |
| Cumulative merge throttle time of primary shards | | 2.51537 | min |
| Min cumulative merge throttle time across primary shards | | 0 | min |
| Median cumulative merge throttle time across primary shards | | 0.1686 | min |
| Max cumulative merge throttle time across primary shards | | 1.50852 | min |
| Cumulative refresh time of primary shards | | 9.00525 | min |
| Cumulative refresh count of primary shards | | 7549 | |
| Min cumulative refresh time across primary shards | | 1.66667e-05 | min |
| Median cumulative refresh time across primary shards | | 0.67525 | min |
| Max cumulative refresh time across primary shards | | 4.7882 | min |
| Cumulative flush time of primary shards | | 0.2505 | min |
| Cumulative flush count of primary shards | | 21 | |
| Min cumulative flush time across primary shards | | 0 | min |
| Median cumulative flush time across primary shards | | 0.024 | min |
| Max cumulative flush time across primary shards | | 0.0693 | min |
| Total Young Gen GC | | 81.66 | s |
| Total Old Gen GC | | 5.16 | s |
| Store size | | 5.01878 | GB |
| Translog size | | 0.427035 | GB |
| Heap used for segments | | 6.30128 | MB |
| Heap used for doc values | | 0.480831 | MB |
| Heap used for terms | | 4.41805 | MB |
| Heap used for norms | | 0.0773926 | MB |
| Heap used for points | | 0 | MB |
| Heap used for stored fields | | 1.325 | MB |
| Segment count | | 137 | |
| Min Throughput | index-append | 35191.3 | docs/s |
| Median Throughput | index-append | 36285.6 | docs/s |
| Max Throughput | index-append | 37512.9 | docs/s |
| 50th percentile latency | index-append | 906.414 | ms |
| 90th percentile latency | index-append | 1558.46 | ms |
| 99th percentile latency | index-append | 2851.12 | ms |
| 99.9th percentile latency | index-append | 3883.7 | ms |
| 100th percentile latency | index-append | 4642.41 | ms |
| 50th percentile service time | index-append | 906.414 | ms |
| 90th percentile service time | index-append | 1558.46 | ms |
| 99th percentile service time | index-append | 2851.12 | ms |
| 99.9th percentile service time | index-append | 3883.7 | ms |
| 100th percentile service time | index-append | 4642.41 | ms |
| error rate | index-append | 0 | % |
| Min Throughput | index-stats | 90.03 | ops/s |
| Median Throughput | index-stats | 90.04 | ops/s |
| Max Throughput | index-stats | 90.09 | ops/s |
| 50th percentile latency | index-stats | 5.46831 | ms |
| 90th percentile latency | index-stats | 7.3398 | ms |
| 99th percentile latency | index-stats | 12.305 | ms |
| 99.9th percentile latency | index-stats | 25.2762 | ms |
| 100th percentile latency | index-stats | 30.9983 | ms |
| 50th percentile service time | index-stats | 5.29481 | ms |
| 90th percentile service time | index-stats | 7.143 | ms |
| 99th percentile service time | index-stats | 11.2478 | ms |
| 99.9th percentile service time | index-stats | 18.8007 | ms |
| 100th percentile service time | index-stats | 23.1404 | ms |
| error rate | index-stats | 0 | % |
| Min Throughput | node-stats | 90.03 | ops/s |
| Median Throughput | node-stats | 90.05 | ops/s |
| Max Throughput | node-stats | 90.17 | ops/s |
| 50th percentile latency | node-stats | 6.28169 | ms |
| 90th percentile latency | node-stats | 9.19621 | ms |
| 99th percentile latency | node-stats | 21.0131 | ms |
| 99.9th percentile latency | node-stats | 30.6636 | ms |
| 100th percentile latency | node-stats | 31.4407 | ms |
| 50th percentile service time | node-stats | 6.12076 | ms |
| 90th percentile service time | node-stats | 8.6181 | ms |
| 99th percentile service time | node-stats | 12.9963 | ms |
| 99.9th percentile service time | node-stats | 21.451 | ms |
| 100th percentile service time | node-stats | 22.0882 | ms |
| error rate | node-stats | 0 | % |
| Min Throughput | default | 50.03 | ops/s |
| Median Throughput | default | 50.04 | ops/s |
| Max Throughput | default | 50.09 | ops/s |
| 50th percentile latency | default | 2.85207 | ms |
| 90th percentile latency | default | 3.47601 | ms |
| 99th percentile latency | default | 8.27729 | ms |
| 99.9th percentile latency | default | 11.4742 | ms |
| 100th percentile latency | default | 15.1836 | ms |
| 50th percentile service time | default | 2.71376 | ms |
| 90th percentile service time | default | 3.3237 | ms |
| 99th percentile service time | default | 8.12787 | ms |
| 99.9th percentile service time | default | 11.3425 | ms |
| 100th percentile service time | default | 15.0477 | ms |
| error rate | default | 0 | % |
| Min Throughput | term | 149.99 | ops/s |
| Median Throughput | term | 150.08 | ops/s |
| Max Throughput | term | 150.15 | ops/s |
| 50th percentile latency | term | 2.7075 | ms |
| 90th percentile latency | term | 3.63481 | ms |
| 99th percentile latency | term | 11.4785 | ms |
| 99.9th percentile latency | term | 28.5046 | ms |
| 100th percentile latency | term | 29.3161 | ms |
| 50th percentile service time | term | 2.57508 | ms |
| 90th percentile service time | term | 3.12235 | ms |
| 99th percentile service time | term | 8.51395 | ms |
| 99.9th percentile service time | term | 11.6366 | ms |
| 100th percentile service time | term | 24.0913 | ms |
| error rate | term | 0 | % |
| Min Throughput | phrase | 149.97 | ops/s |
| Median Throughput | phrase | 150.07 | ops/s |
| Max Throughput | phrase | 150.12 | ops/s |
| 50th percentile latency | phrase | 2.90364 | ms |
| 90th percentile latency | phrase | 4.05387 | ms |
| 99th percentile latency | phrase | 10.9091 | ms |
| 99.9th percentile latency | phrase | 15.8571 | ms |
| 100th percentile latency | phrase | 18.0298 | ms |
| 50th percentile service time | phrase | 2.76558 | ms |
| 90th percentile service time | phrase | 3.65825 | ms |
| 99th percentile service time | phrase | 8.58339 | ms |
| 99.9th percentile service time | phrase | 15.7333 | ms |
| 100th percentile service time | phrase | 17.6683 | ms |
| error rate | phrase | 0 | % |
| Min Throughput | country_agg_uncached | 4 | ops/s |
| Median Throughput | country_agg_uncached | 4 | ops/s |
| Max Throughput | country_agg_uncached | 4 | ops/s |
| 50th percentile latency | country_agg_uncached | 211.422 | ms |
| 90th percentile latency | country_agg_uncached | 245.382 | ms |
| 99th percentile latency | country_agg_uncached | 302.092 | ms |
| 100th percentile latency | country_agg_uncached | 330.333 | ms |
| 50th percentile service time | country_agg_uncached | 211.091 | ms |
| 90th percentile service time | country_agg_uncached | 236.81 | ms |
| 99th percentile service time | country_agg_uncached | 281.005 | ms |
| 100th percentile service time | country_agg_uncached | 330.201 | ms |
| error rate | country_agg_uncached | 0 | % |
| Min Throughput | country_agg_cached | 100.02 | ops/s |
| Median Throughput | country_agg_cached | 100.05 | ops/s |
| Max Throughput | country_agg_cached | 100.08 | ops/s |
| 50th percentile latency | country_agg_cached | 2.11409 | ms |
| 90th percentile latency | country_agg_cached | 2.59148 | ms |
| 99th percentile latency | country_agg_cached | 7.41716 | ms |
| 99.9th percentile latency | country_agg_cached | 9.37343 | ms |
| 100th percentile latency | country_agg_cached | 10.3364 | ms |
| 50th percentile service time | country_agg_cached | 1.98214 | ms |
| 90th percentile service time | country_agg_cached | 2.42823 | ms |
| 99th percentile service time | country_agg_cached | 7.01208 | ms |
| 99.9th percentile service time | country_agg_cached | 9.23088 | ms |
| 100th percentile service time | country_agg_cached | 10.2108 | ms |
| error rate | country_agg_cached | 0 | % |
| Min Throughput | scroll | 20.03 | pages/s |
| Median Throughput | scroll | 20.04 | pages/s |
| Max Throughput | scroll | 20.06 | pages/s |
| 50th percentile latency | scroll | 582.204 | ms |
| 90th percentile latency | scroll | 615.713 | ms |
| 99th percentile latency | scroll | 632.514 | ms |
| 100th percentile latency | scroll | 637.954 | ms |
| 50th percentile service time | scroll | 581.951 | ms |
| 90th percentile service time | scroll | 615.554 | ms |
| 99th percentile service time | scroll | 632.221 | ms |
| 100th percentile service time | scroll | 637.899 | ms |
| error rate | scroll | 0 | % |
| Min Throughput | expression | 2 | ops/s |
| Median Throughput | expression | 2 | ops/s |
| Max Throughput | expression | 2 | ops/s |
| 50th percentile latency | expression | 450.606 | ms |
| 90th percentile latency | expression | 530.641 | ms |
| 99th percentile latency | expression | 669.343 | ms |
| 100th percentile latency | expression | 722.308 | ms |
| 50th percentile service time | expression | 446.809 | ms |
| 90th percentile service time | expression | 498.111 | ms |
| 99th percentile service time | expression | 581.37 | ms |
| 100th percentile service time | expression | 722.164 | ms |
| error rate | expression | 0 | % |
| Min Throughput | painless_static | 1.48 | ops/s |
| Median Throughput | painless_static | 1.5 | ops/s |
| Max Throughput | painless_static | 1.5 | ops/s |
| 50th percentile latency | painless_static | 534.496 | ms |
| 90th percentile latency | painless_static | 1998.36 | ms |
| 99th percentile latency | painless_static | 2558 | ms |
| 100th percentile latency | painless_static | 2608.9 | ms |
| 50th percentile service time | painless_static | 512.585 | ms |
| 90th percentile service time | painless_static | 731.34 | ms |
| 99th percentile service time | painless_static | 883.611 | ms |
| 100th percentile service time | painless_static | 886.822 | ms |
| error rate | painless_static | 0 | % |
| Min Throughput | painless_dynamic | 1.5 | ops/s |
| Median Throughput | painless_dynamic | 1.5 | ops/s |
| Max Throughput | painless_dynamic | 1.5 | ops/s |
| 50th percentile latency | painless_dynamic | 514.648 | ms |
| 90th percentile latency | painless_dynamic | 618.23 | ms |
| 99th percentile latency | painless_dynamic | 765.562 | ms |
| 100th percentile latency | painless_dynamic | 788.638 | ms |
| 50th percentile service time | painless_dynamic | 514.42 | ms |
| 90th percentile service time | painless_dynamic | 609.495 | ms |
| 99th percentile service time | painless_dynamic | 738.131 | ms |
| 100th percentile service time | painless_dynamic | 765.091 | ms |
| error rate | painless_dynamic | 0 | % |
| Min Throughput | decay_geo_gauss_function_score | 1 | ops/s |
| Median Throughput | decay_geo_gauss_function_score | 1 | ops/s |
| Max Throughput | decay_geo_gauss_function_score | 1 | ops/s |
| 50th percentile latency | decay_geo_gauss_function_score | 441.497 | ms |
| 90th percentile latency | decay_geo_gauss_function_score | 469.3 | ms |
| 99th percentile latency | decay_geo_gauss_function_score | 522.121 | ms |
| 100th percentile latency | decay_geo_gauss_function_score | 544.074 | ms |
| 50th percentile service time | decay_geo_gauss_function_score | 440.565 | ms |
| 90th percentile service time | decay_geo_gauss_function_score | 468.678 | ms |
| 99th percentile service time | decay_geo_gauss_function_score | 521.47 | ms |
| 100th percentile service time | decay_geo_gauss_function_score | 543.459 | ms |
| error rate | decay_geo_gauss_function_score | 0 | % |
| Min Throughput | decay_geo_gauss_script_score | 1 | ops/s |
| Median Throughput | decay_geo_gauss_script_score | 1 | ops/s |
| Max Throughput | decay_geo_gauss_script_score | 1 | ops/s |
| 50th percentile latency | decay_geo_gauss_script_score | 433.563 | ms |
| 90th percentile latency | decay_geo_gauss_script_score | 469.586 | ms |
| 99th percentile latency | decay_geo_gauss_script_score | 513.173 | ms |
| 100th percentile latency | decay_geo_gauss_script_score | 533.614 | ms |
| 50th percentile service time | decay_geo_gauss_script_score | 432.905 | ms |
| 90th percentile service time | decay_geo_gauss_script_score | 468.938 | ms |
| 99th percentile service time | decay_geo_gauss_script_score | 512.731 | ms |
| 100th percentile service time | decay_geo_gauss_script_score | 532.954 | ms |
| error rate | decay_geo_gauss_script_score | 0 | % |
| Min Throughput | field_value_function_score | 1.5 | ops/s |
| Median Throughput | field_value_function_score | 1.5 | ops/s |
| Max Throughput | field_value_function_score | 1.51 | ops/s |
| 50th percentile latency | field_value_function_score | 201.503 | ms |
| 90th percentile latency | field_value_function_score | 239.107 | ms |
| 99th percentile latency | field_value_function_score | 267.965 | ms |
| 100th percentile latency | field_value_function_score | 272.576 | ms |
| 50th percentile service time | field_value_function_score | 200.966 | ms |
| 90th percentile service time | field_value_function_score | 238.52 | ms |
| 99th percentile service time | field_value_function_score | 267.421 | ms |
| 100th percentile service time | field_value_function_score | 272.01 | ms |
| error rate | field_value_function_score | 0 | % |
| Min Throughput | field_value_script_score | 1.5 | ops/s |
| Median Throughput | field_value_script_score | 1.5 | ops/s |
| Max Throughput | field_value_script_score | 1.5 | ops/s |
| 50th percentile latency | field_value_script_score | 253.307 | ms |
| 90th percentile latency | field_value_script_score | 308.51 | ms |
| 99th percentile latency | field_value_script_score | 338.735 | ms |
| 100th percentile latency | field_value_script_score | 401.192 | ms |
| 50th percentile service time | field_value_script_score | 252.917 | ms |
| 90th percentile service time | field_value_script_score | 307.992 | ms |
| 99th percentile service time | field_value_script_score | 338.432 | ms |
| 100th percentile service time | field_value_script_score | 400.707 | ms |
| error rate | field_value_script_score | 0 | % |
| Min Throughput | random_function_score | 1.5 | ops/s |
| Median Throughput | random_function_score | 1.5 | ops/s |
| Max Throughput | random_function_score | 1.5 | ops/s |
| 50th percentile latency | random_function_score | 374.168 | ms |
| 90th percentile latency | random_function_score | 446.646 | ms |
| 99th percentile latency | random_function_score | 568.612 | ms |
| 100th percentile latency | random_function_score | 603.844 | ms |
| 50th percentile service time | random_function_score | 373.772 | ms |
| 90th percentile service time | random_function_score | 446.269 | ms |
| 99th percentile service time | random_function_score | 568.204 | ms |
| 100th percentile service time | random_function_score | 603.799 | ms |
| error rate | random_function_score | 0 | % |
| Min Throughput | random_script_score | 1.5 | ops/s |
| Median Throughput | random_script_score | 1.5 | ops/s |
| Max Throughput | random_script_score | 1.5 | ops/s |
| 50th percentile latency | random_script_score | 395.82 | ms |
| 90th percentile latency | random_script_score | 444.656 | ms |
| 99th percentile latency | random_script_score | 540.626 | ms |
| 100th percentile latency | random_script_score | 570.042 | ms |
| 50th percentile service time | random_script_score | 395.476 | ms |
| 90th percentile service time | random_script_score | 444.283 | ms |
| 99th percentile service time | random_script_score | 540.213 | ms |
| 100th percentile service time | random_script_score | 569.757 | ms |
| error rate | random_script_score | 0 | % |
| Min Throughput | large_terms | 1.1 | ops/s |
| Median Throughput | large_terms | 1.1 | ops/s |
| Max Throughput | large_terms | 1.1 | ops/s |
| 50th percentile latency | large_terms | 748.777 | ms |
| 90th percentile latency | large_terms | 817.525 | ms |
| 99th percentile latency | large_terms | 901.205 | ms |
| 100th percentile latency | large_terms | 901.317 | ms |
| 50th percentile service time | large_terms | 748.519 | ms |
| 90th percentile service time | large_terms | 817.3 | ms |
| 99th percentile service time | large_terms | 901.019 | ms |
| 100th percentile service time | large_terms | 901.127 | ms |
| error rate | large_terms | 0 | % |
| Min Throughput | large_filtered_terms | 1.1 | ops/s |
| Median Throughput | large_filtered_terms | 1.1 | ops/s |
| Max Throughput | large_filtered_terms | 1.1 | ops/s |
| 50th percentile latency | large_filtered_terms | 753.142 | ms |
| 90th percentile latency | large_filtered_terms | 810.3 | ms |
| 99th percentile latency | large_filtered_terms | 852.57 | ms |
| 100th percentile latency | large_filtered_terms | 910.373 | ms |
| 50th percentile service time | large_filtered_terms | 752.901 | ms |
| 90th percentile service time | large_filtered_terms | 810.182 | ms |
| 99th percentile service time | large_filtered_terms | 852.334 | ms |
| 100th percentile service time | large_filtered_terms | 910.213 | ms |
| error rate | large_filtered_terms | 0 | % |
| Min Throughput | large_prohibited_terms | 1.1 | ops/s |
| Median Throughput | large_prohibited_terms | 1.1 | ops/s |
| Max Throughput | large_prohibited_terms | 1.1 | ops/s |
| 50th percentile latency | large_prohibited_terms | 721.88 | ms |
| 90th percentile latency | large_prohibited_terms | 770.86 | ms |
| 99th percentile latency | large_prohibited_terms | 853.662 | ms |
| 100th percentile latency | large_prohibited_terms | 879.379 | ms |
| 50th percentile service time | large_prohibited_terms | 721.619 | ms |
| 90th percentile service time | large_prohibited_terms | 770.621 | ms |
| 99th percentile service time | large_prohibited_terms | 853.38 | ms |
| 100th percentile service time | large_prohibited_terms | 879.101 | ms |
| error rate | large_prohibited_terms | 0 | % |
| Min Throughput | desc_sort_population | 1.5 | ops/s |
| Median Throughput | desc_sort_population | 1.51 | ops/s |
| Max Throughput | desc_sort_population | 1.51 | ops/s |
| 50th percentile latency | desc_sort_population | 72.3114 | ms |
| 90th percentile latency | desc_sort_population | 100.172 | ms |
| 99th percentile latency | desc_sort_population | 120.597 | ms |
| 100th percentile latency | desc_sort_population | 131.459 | ms |
| 50th percentile service time | desc_sort_population | 71.6962 | ms |
| 90th percentile service time | desc_sort_population | 99.4831 | ms |
| 99th percentile service time | desc_sort_population | 120.212 | ms |
| 100th percentile service time | desc_sort_population | 130.794 | ms |
| error rate | desc_sort_population | 0 | % |
| Min Throughput | asc_sort_population | 1.5 | ops/s |
| Median Throughput | asc_sort_population | 1.51 | ops/s |
| Max Throughput | asc_sort_population | 1.51 | ops/s |
| 50th percentile latency | asc_sort_population | 78.7132 | ms |
| 90th percentile latency | asc_sort_population | 98.781 | ms |
| 99th percentile latency | asc_sort_population | 131.35 | ms |
| 100th percentile latency | asc_sort_population | 141.935 | ms |
| 50th percentile service time | asc_sort_population | 78.1764 | ms |
| 90th percentile service time | asc_sort_population | 98.0992 | ms |
| 99th percentile service time | asc_sort_population | 130.681 | ms |
| 100th percentile service time | asc_sort_population | 141.837 | ms |
| error rate | asc_sort_population | 0 | % |
| Min Throughput | desc_sort_geonameid | 6.02 | ops/s |
| Median Throughput | desc_sort_geonameid | 6.02 | ops/s |
| Max Throughput | desc_sort_geonameid | 6.03 | ops/s |
| 50th percentile latency | desc_sort_geonameid | 9.598 | ms |
| 90th percentile latency | desc_sort_geonameid | 12.6686 | ms |
| 99th percentile latency | desc_sort_geonameid | 15.488 | ms |
| 100th percentile latency | desc_sort_geonameid | 17.4104 | ms |
| 50th percentile service time | desc_sort_geonameid | 9.33445 | ms |
| 90th percentile service time | desc_sort_geonameid | 12.4203 | ms |
| 99th percentile service time | desc_sort_geonameid | 15.2173 | ms |
| 100th percentile service time | desc_sort_geonameid | 17.1632 | ms |
| error rate | desc_sort_geonameid | 0 | % |
| Min Throughput | asc_sort_geonameid | 6.02 | ops/s |
| Median Throughput | asc_sort_geonameid | 6.02 | ops/s |
| Max Throughput | asc_sort_geonameid | 6.03 | ops/s |
| 50th percentile latency | asc_sort_geonameid | 6.76333 | ms |
| 90th percentile latency | asc_sort_geonameid | 7.93888 | ms |
| 99th percentile latency | asc_sort_geonameid | 14.5112 | ms |
| 100th percentile latency | asc_sort_geonameid | 51.2398 | ms |
| 50th percentile service time | asc_sort_geonameid | 6.54607 | ms |
| 90th percentile service time | asc_sort_geonameid | 7.76287 | ms |
| 99th percentile service time | asc_sort_geonameid | 14.2626 | ms |
| 100th percentile service time | asc_sort_geonameid | 50.9501 | ms |
| error rate | asc_sort_geonameid | 0 | % |


----------------------------------
[INFO] SUCCESS (took 4218 seconds)
----------------------------------
Check back in this space for more information on ElasticSearch in the future.
Important Links
Access Director online - https://director.mayadata.io
For help - https://help.mayadata.io
Join OpenEBS community — https://slack.openebs.io


Game changer in Container and Storage Paradigm- MayaData gets acquired by DataCore Software
Don Williams
Don Williams
Managing Ephemeral Storage on Kubernetes with OpenEBS
Kiran Mova
Kiran Mova
Understanding Persistent Volumes and PVCs in Kubernetes & OpenEBS
Murat Karslioglu
Murat Karslioglu